¶ 📡 Uptime Monitoring
🎥 Watch Video — Introduction to features, usage, and UI.
¶ 🧐 What is this?
This tool helps monitor the availability and performance of your assets — ensuring they stay online, responsive, and healthy.
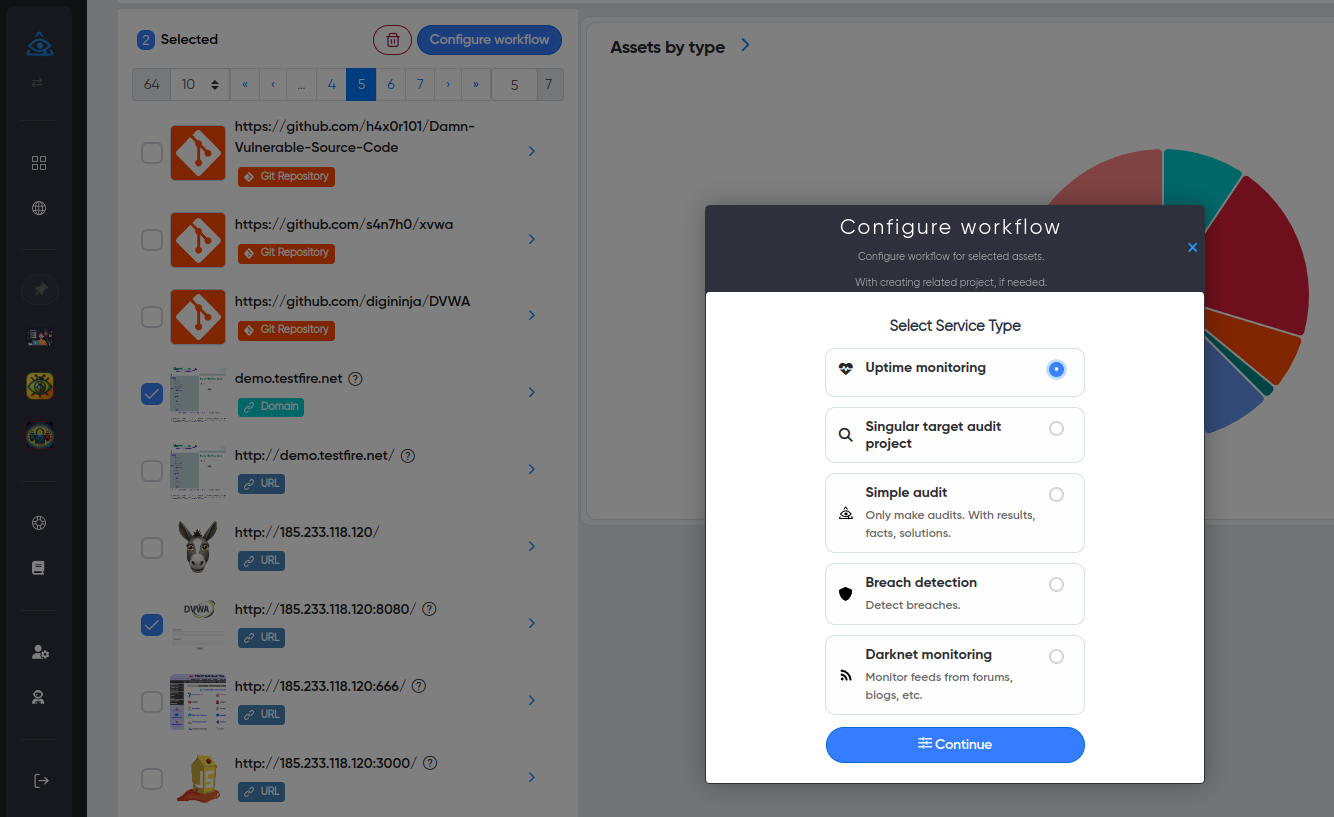
¶ ➕ Add Assets for Monitoring
You can connect supported assets from your Workspace to the "Uptime Monitoring" service.
¶ ✅ Steps:
- Select the desired asset(s) in Workspace.
- Click "Configure Workflow".
- In the modal window, choose "Uptime Monitoring" and click Continue.
🎯 Done — your asset is now monitored.
¶ 💓 How It Works
We regularly check each asset’s condition — just like a heartbeat.
The frequency and method depend on the type of monitor.
¶ 📊 Types of Monitors
You can connect multiple monitor types:
- HTTP(s) — great for websites
- Ping (ICMP) — check domain/IP with ping
- Socket — test host:port pair (e.g., SSH)
- Push — asset sends its own heartbeat to us
¶ 🧩 Monitor Configuration
Each monitor has:
- General options (timeouts, retries, etc.)
- Type-specific options (e.g., status codes for HTTP)
¶ 🔍 Monitor Types in Detail
¶ 🌐 HTTPS Monitor
Used to check internet-facing websites using HTTP(S).
¶ 📶 Ping Monitor (ICMP)
Simple ping for domains or IPs.
¶ 🔌 Socket Monitor
Check host/port availability. Useful for services like SSH.
¶ 📬 Push Monitor
If your asset can't be reached directly, you can send a "heartbeat" to us from the asset itself.
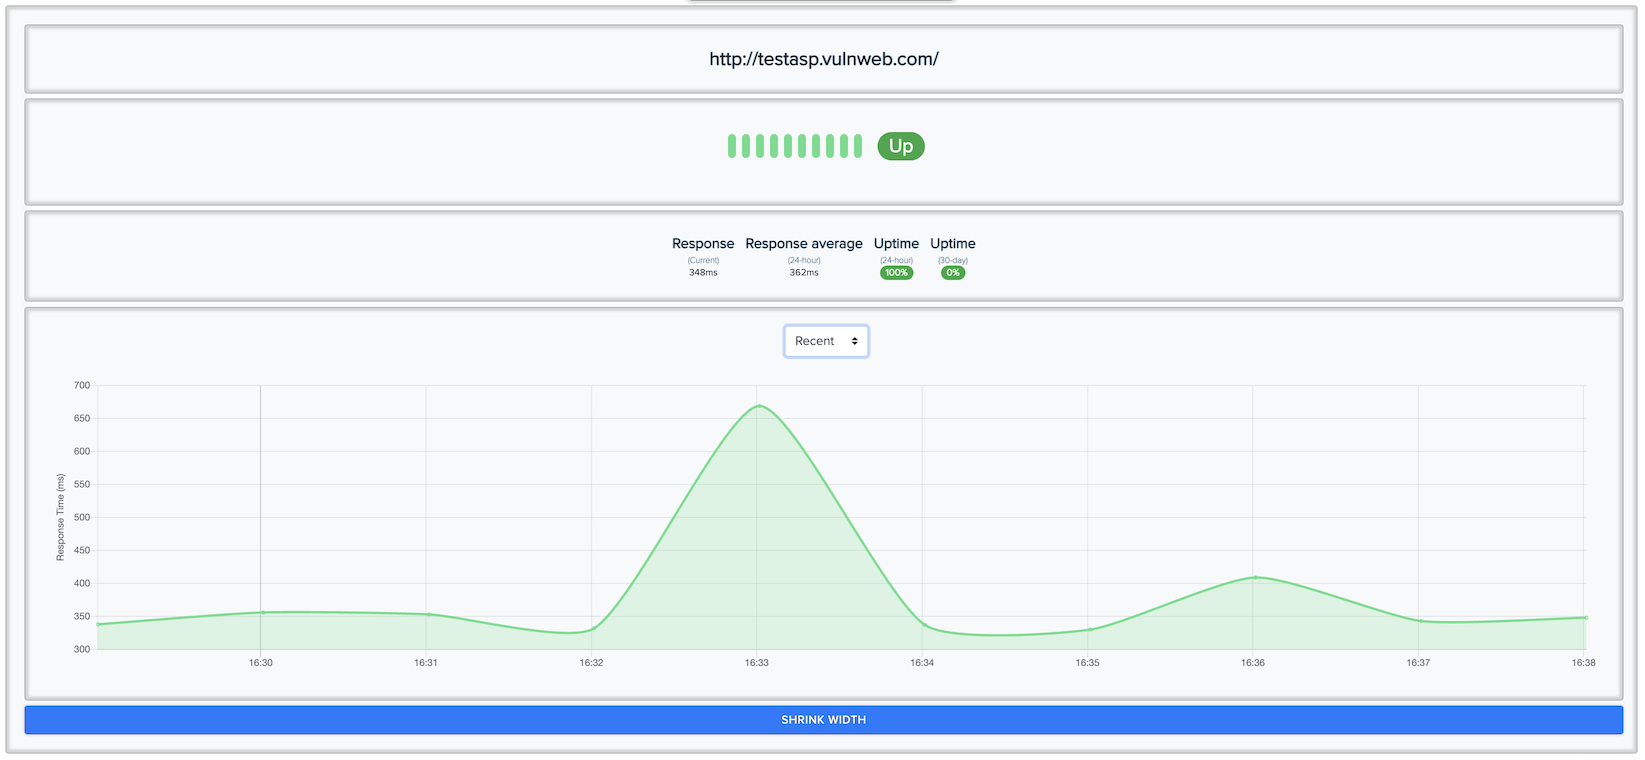
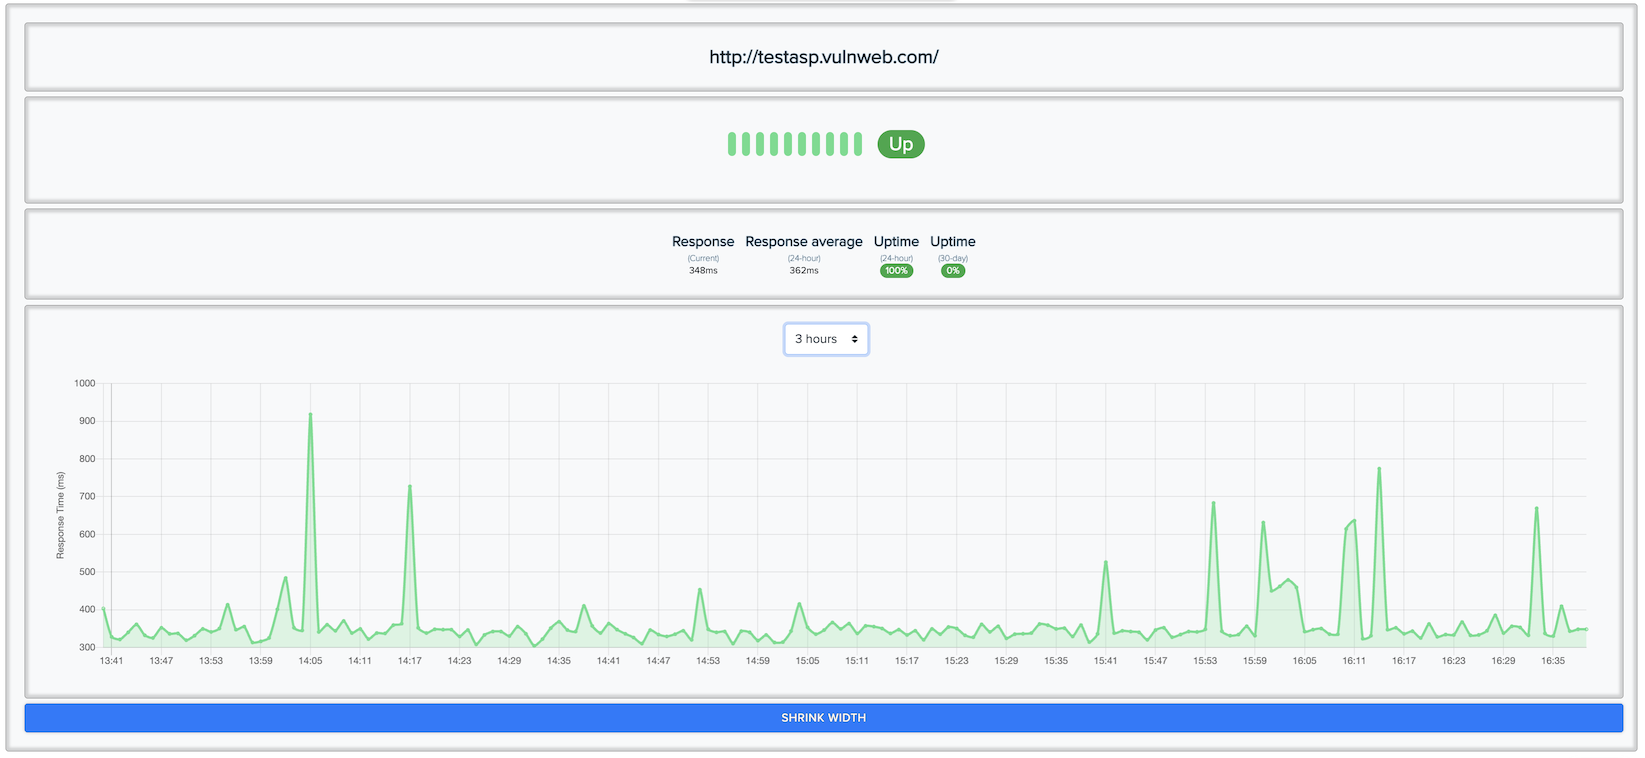
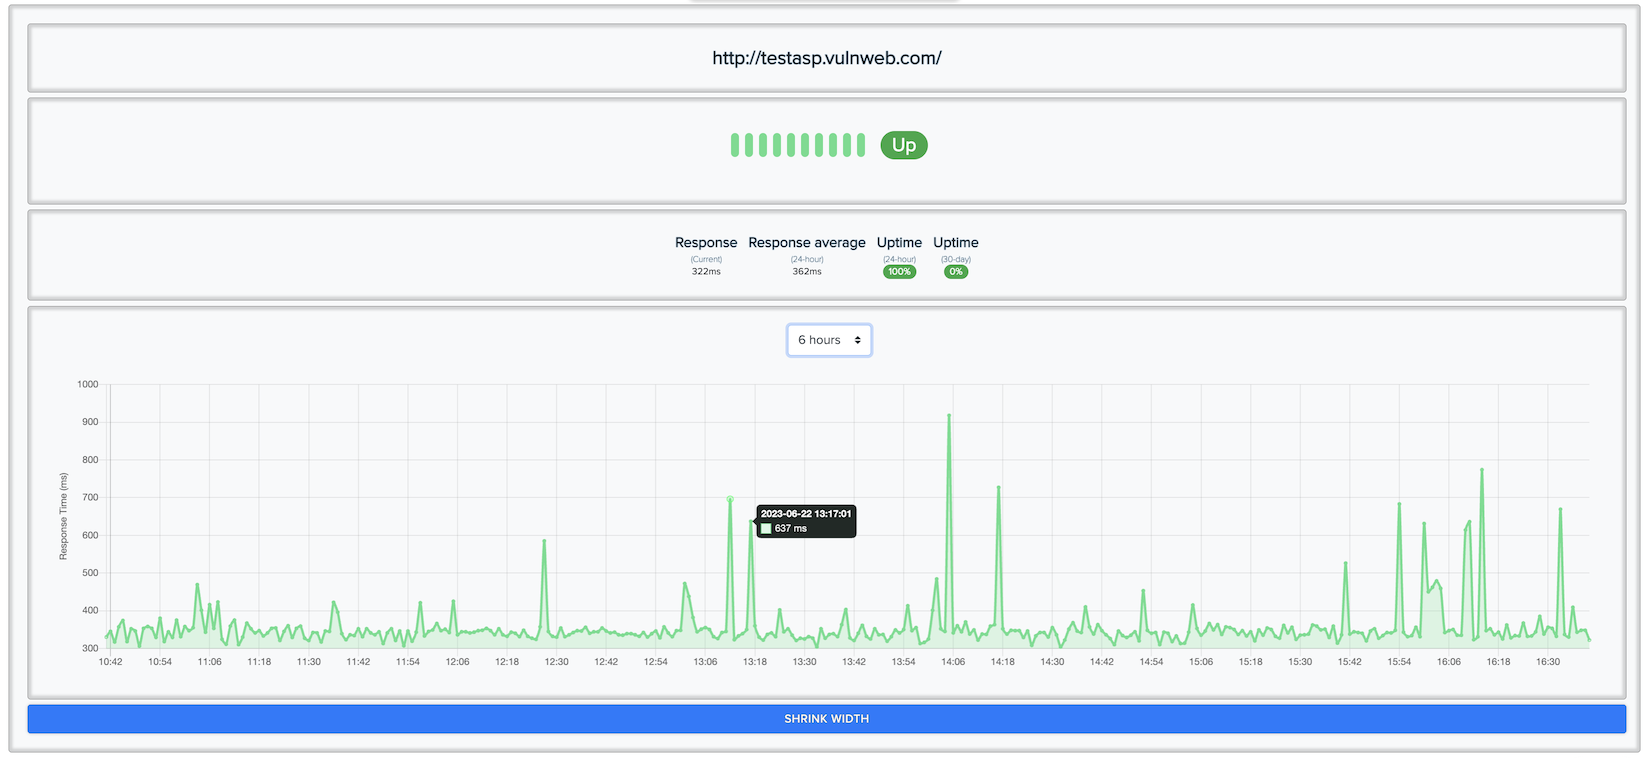
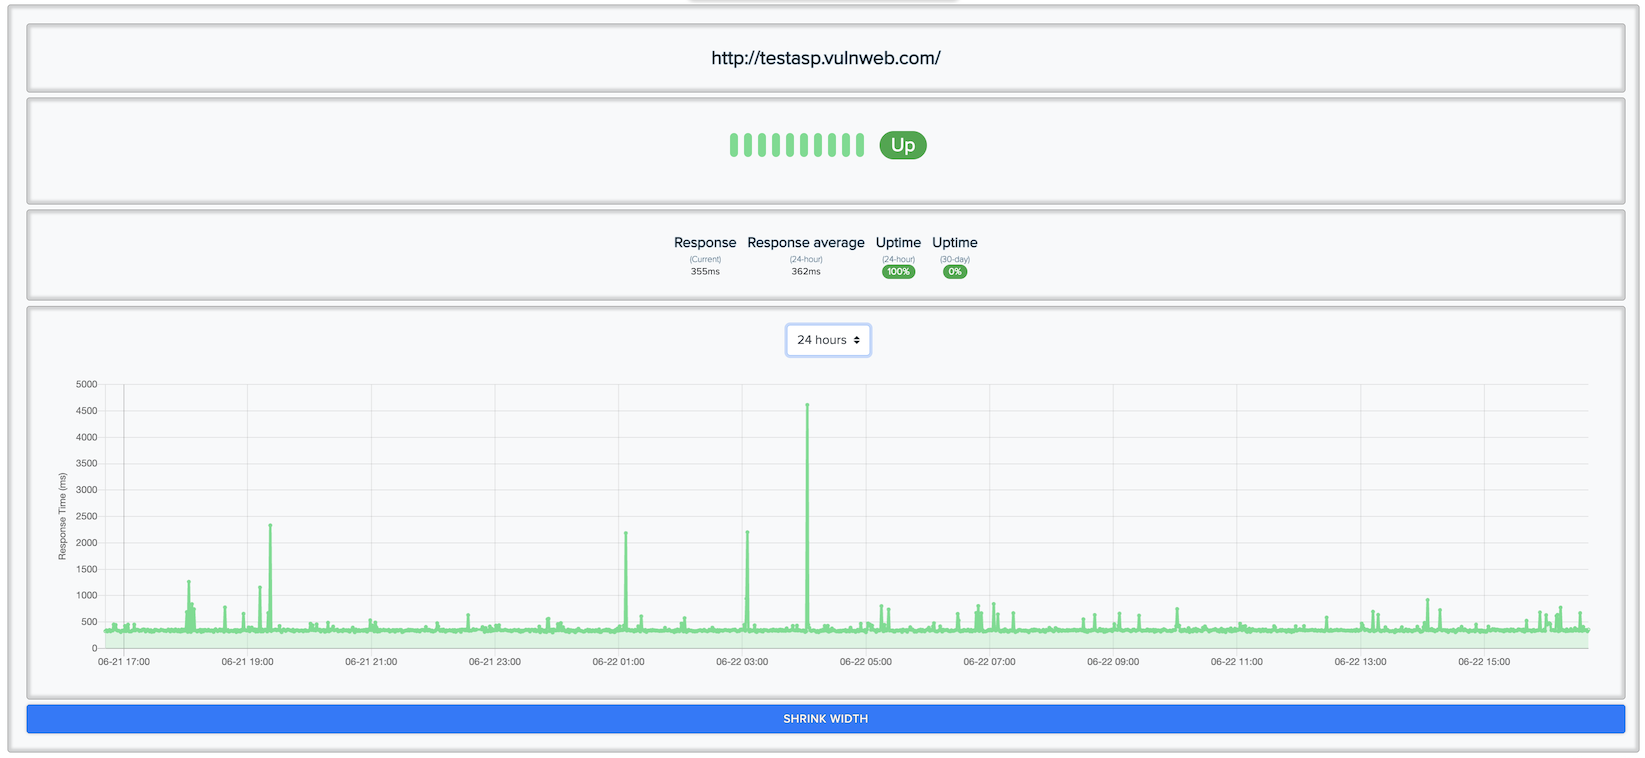
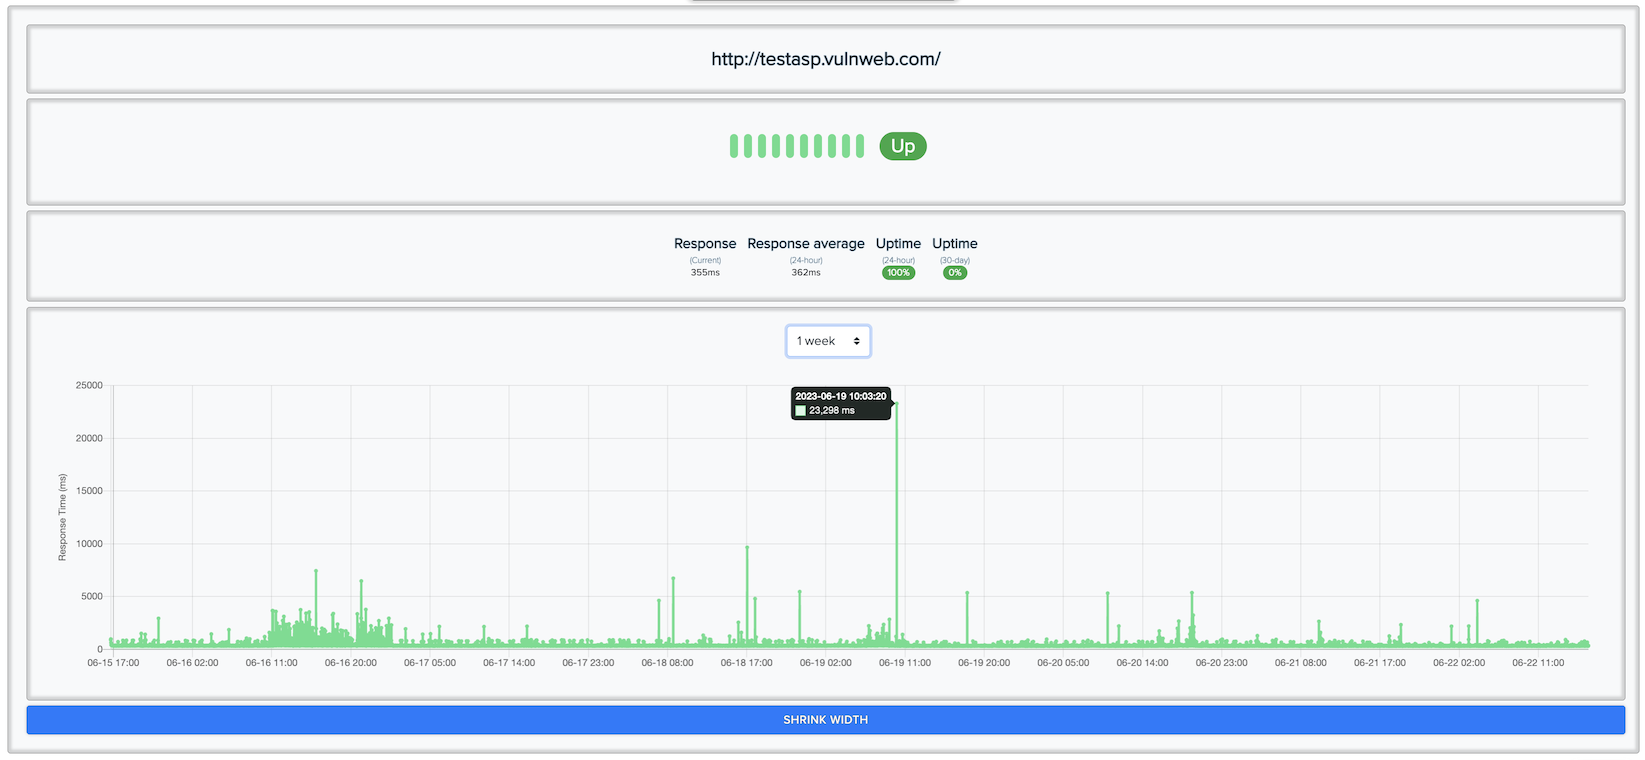
¶ 📈 Statistics
Monitor historical uptime and response performance over:
- Last hour
- 3 hours
- 6 hours
- 24 hours
- 1 week
¶ Availability Metrics:
- % uptime over selected periods
- Average response time (if applicable)
¶ Example Charts:
- Recent
- 3 hours
- 6 hours
- 24 hours
- 1 week
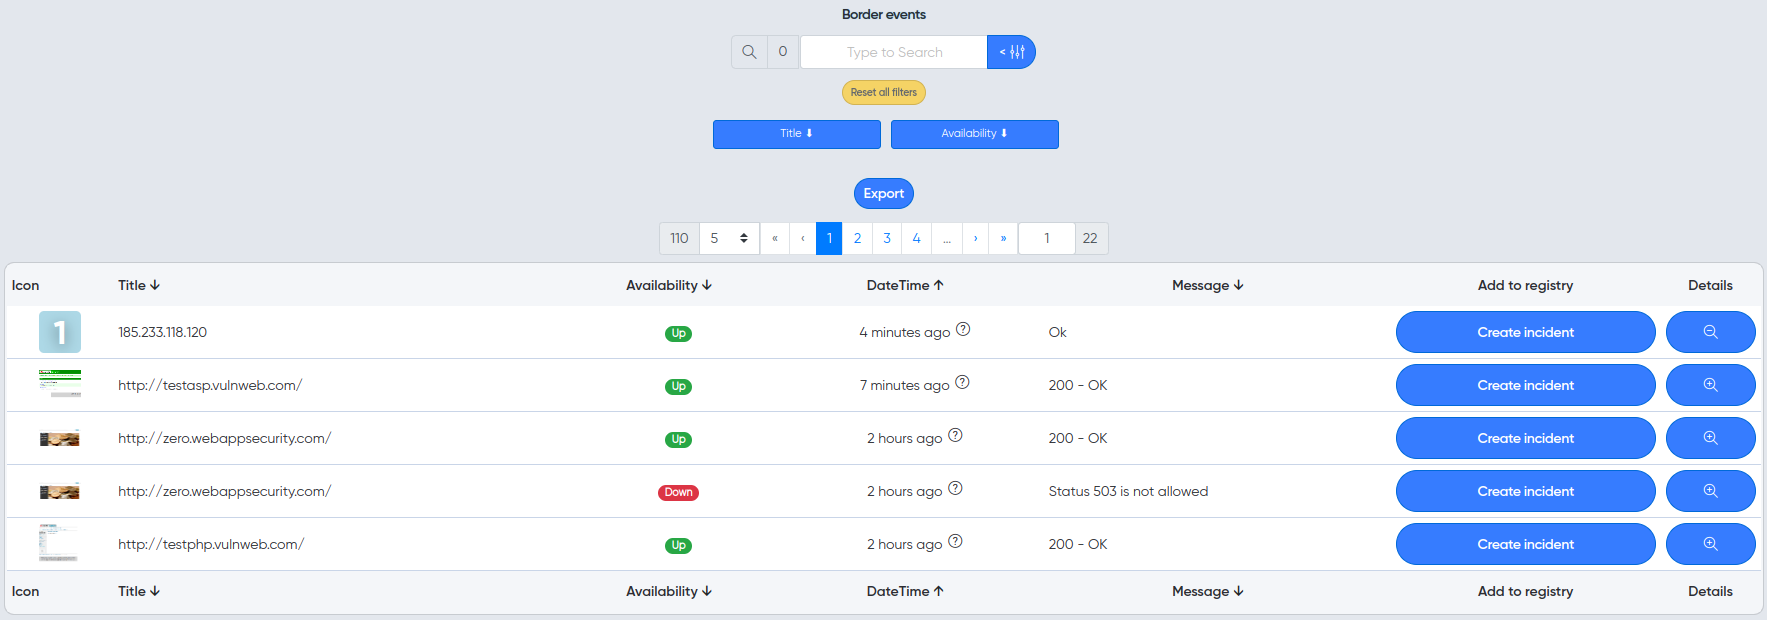
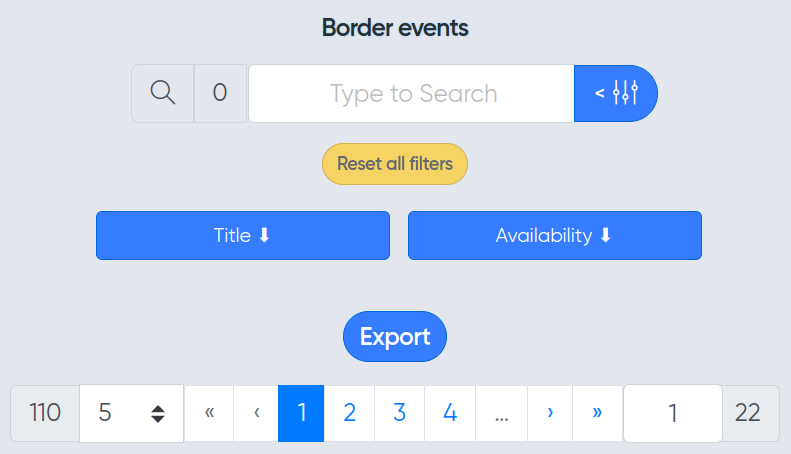
¶ 🚨 Border Events
If an asset goes down or comes back up, we log it as a border event.
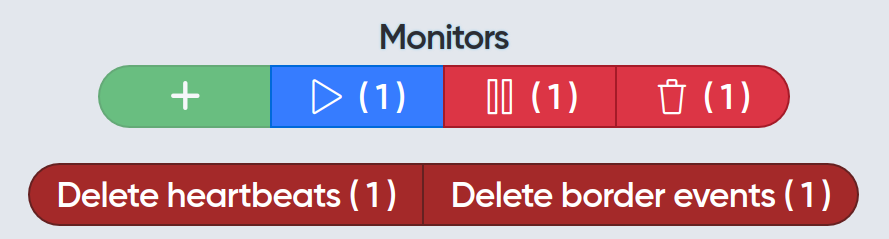
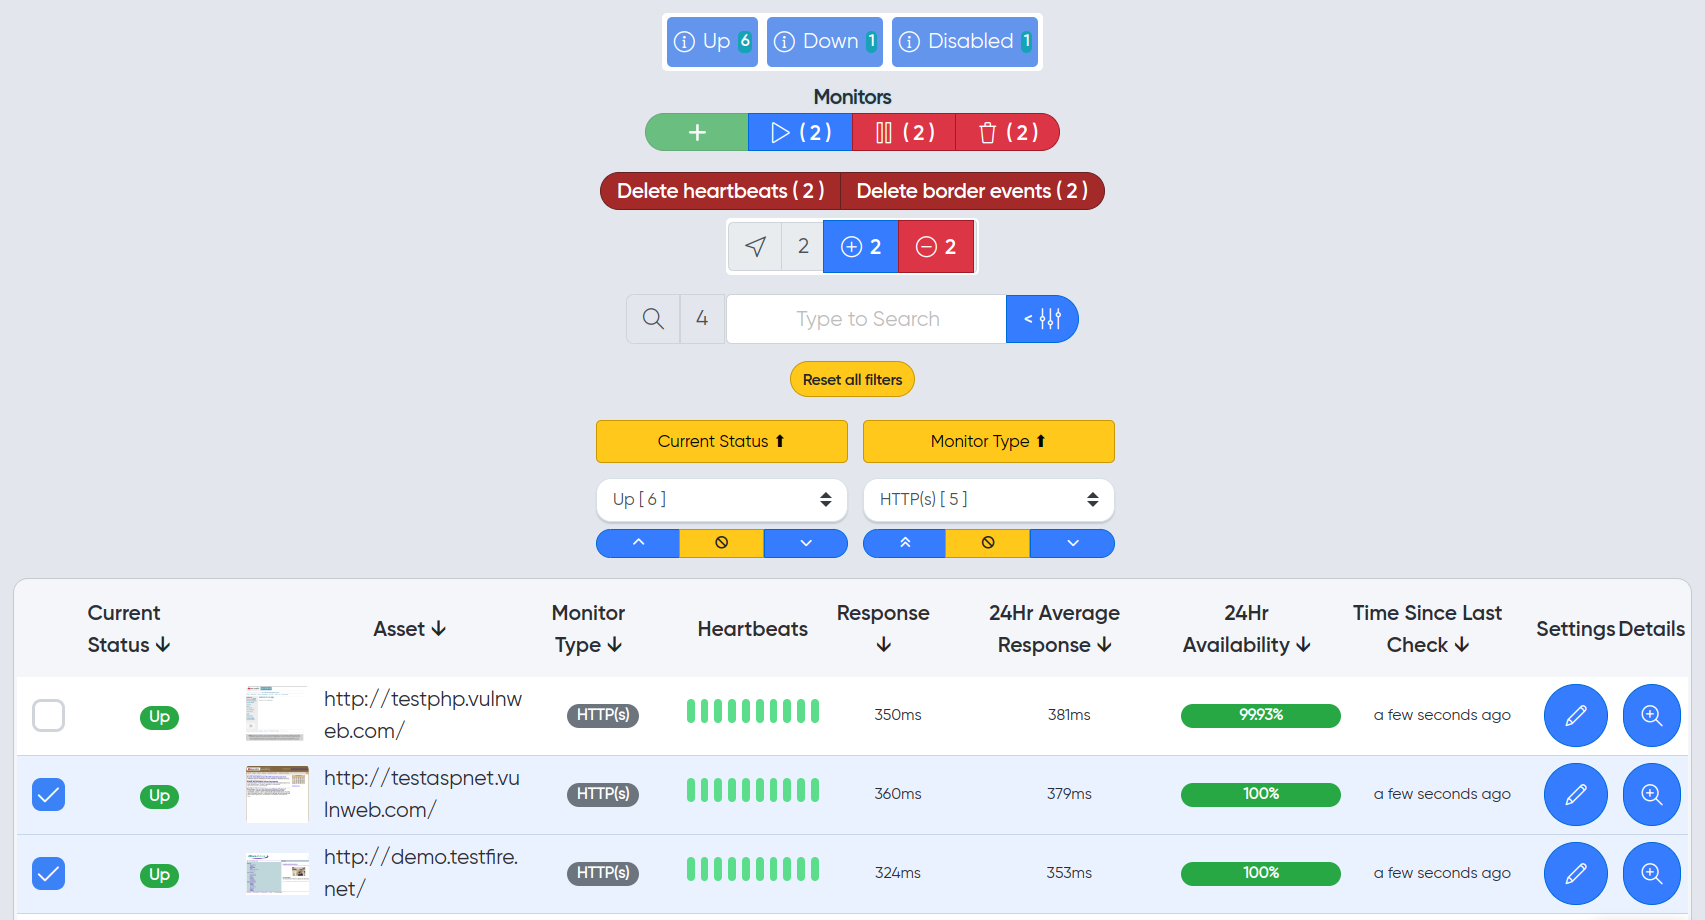
¶ 🧭 Control Panel
¶ Without selecting assets, you can:
- ✅ Mass enable/disable monitors
- ➕ Add / ❌ Remove monitors

¶ With asset selection, you can:
- 🗑️ Clear heartbeat & event history
- ⚙️ Edit specific monitor configs
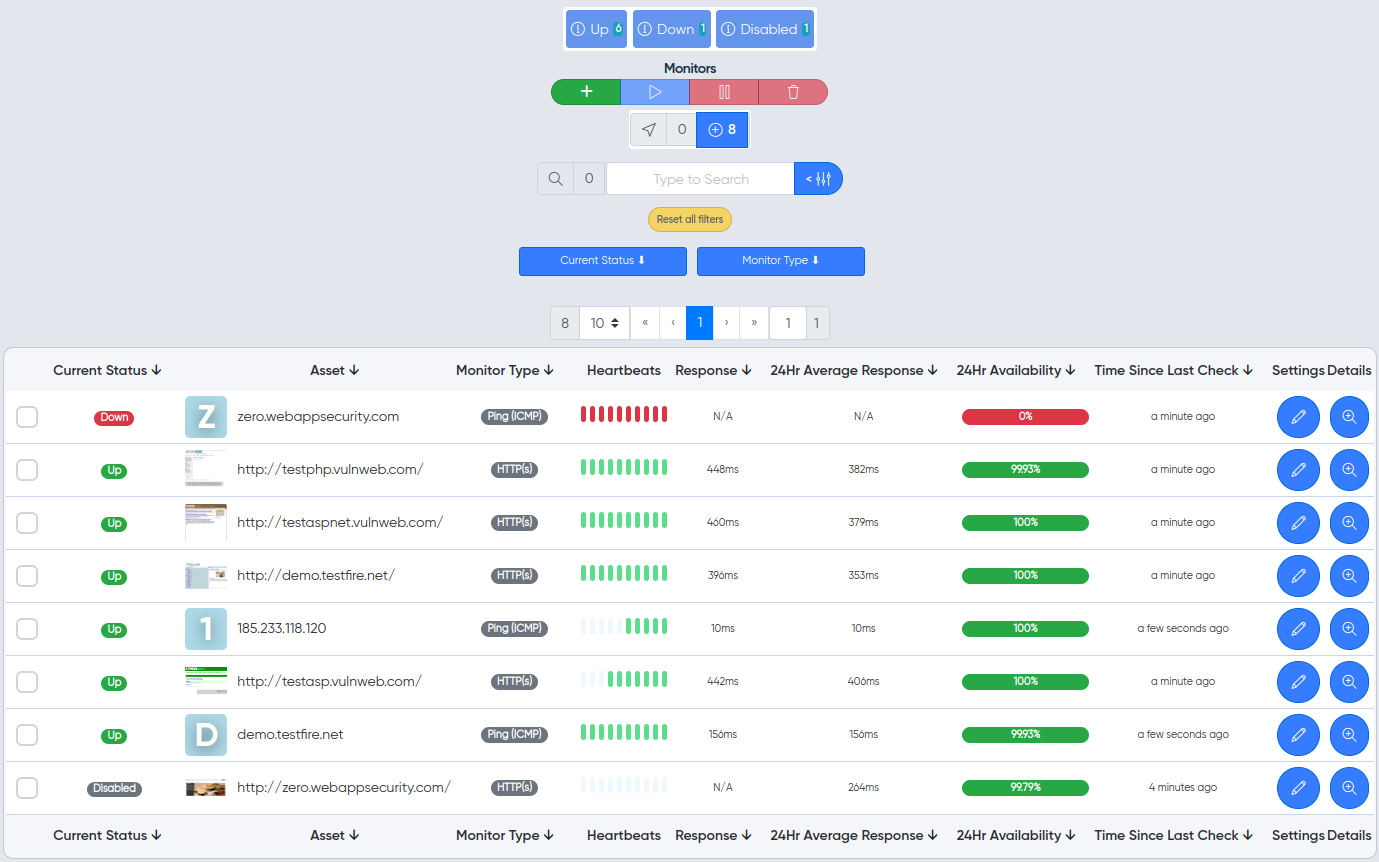
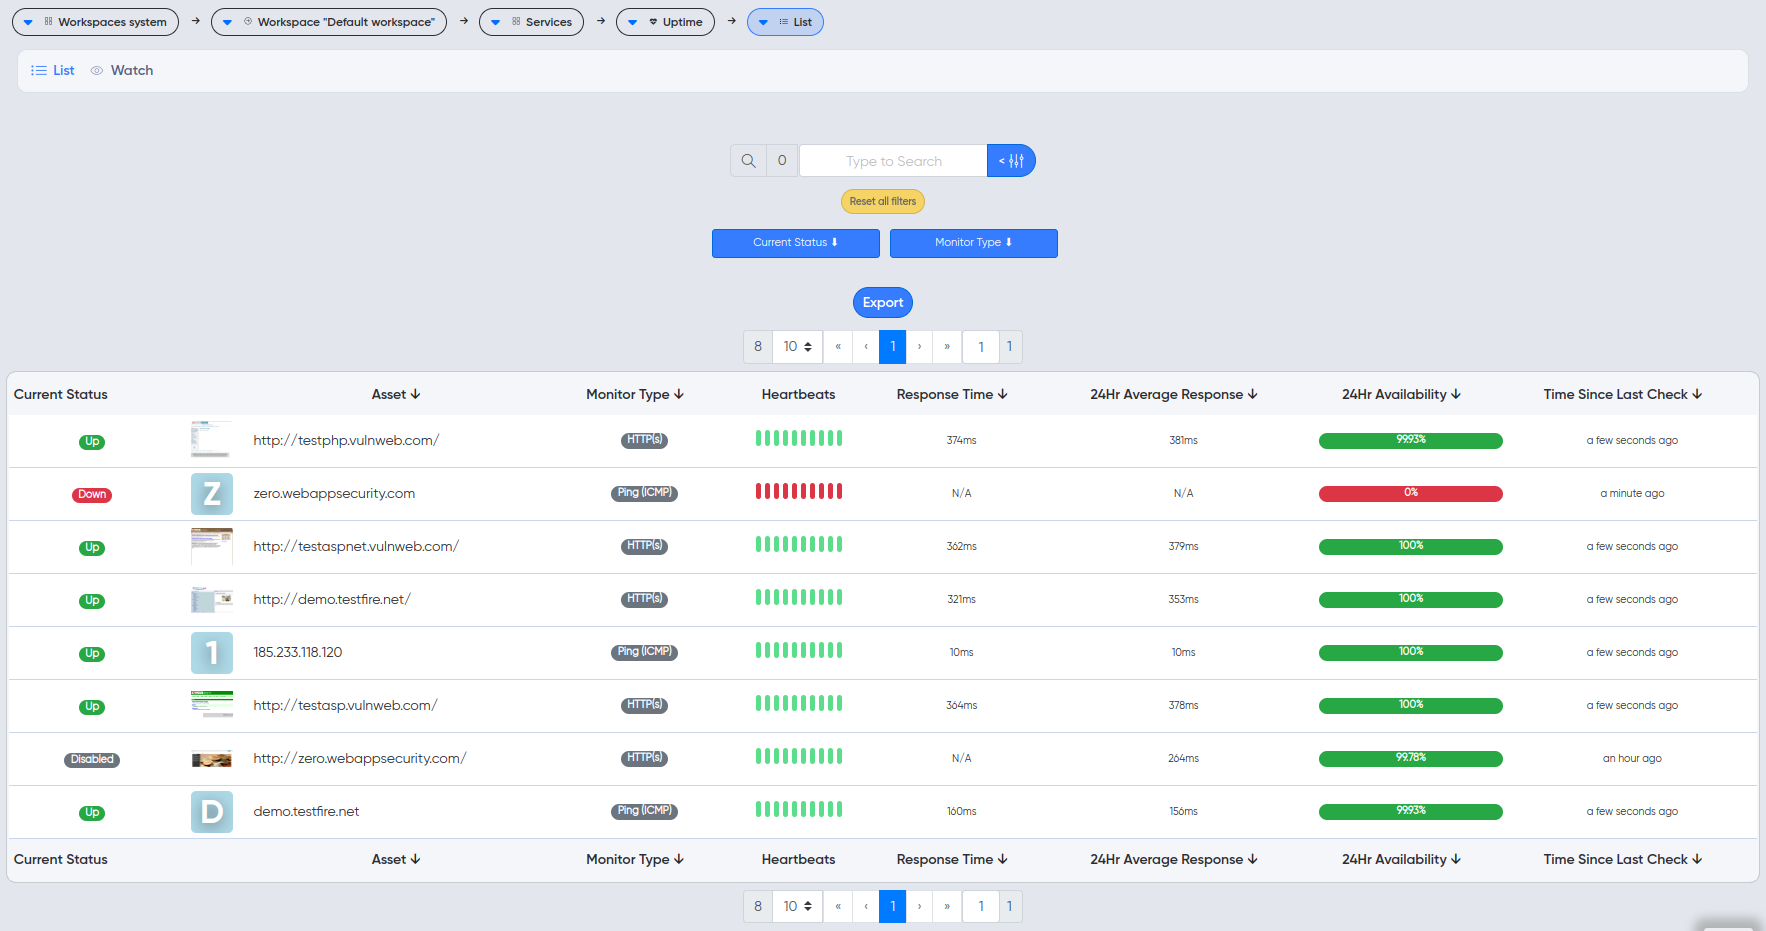
¶ 🔎 Live Watch
Monitor asset statuses in real-time.
- DOWN assets appear first (priority sorting)
- DISABLED assets show last
Includes general counters and health status.

¶ 📋 Full Asset List
View all assets added to Uptime Monitoring.
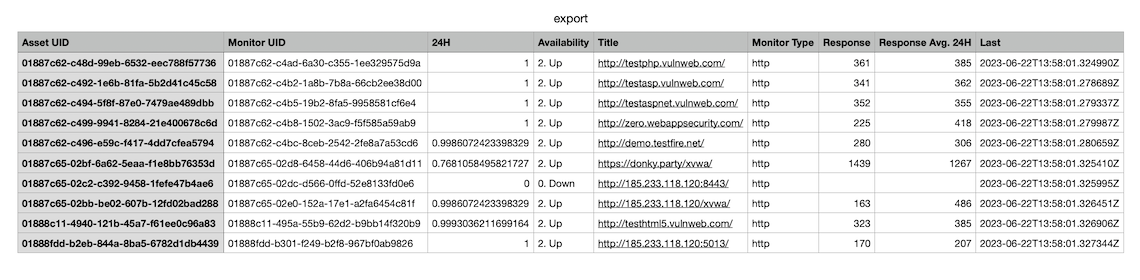
¶ 📤 Report Export
Export border event data into CSV:
¶ Steps:
- Go to "Border Events".
- Click Export.
- Choose fields and confirm.
📥 The report downloads as a .csv.
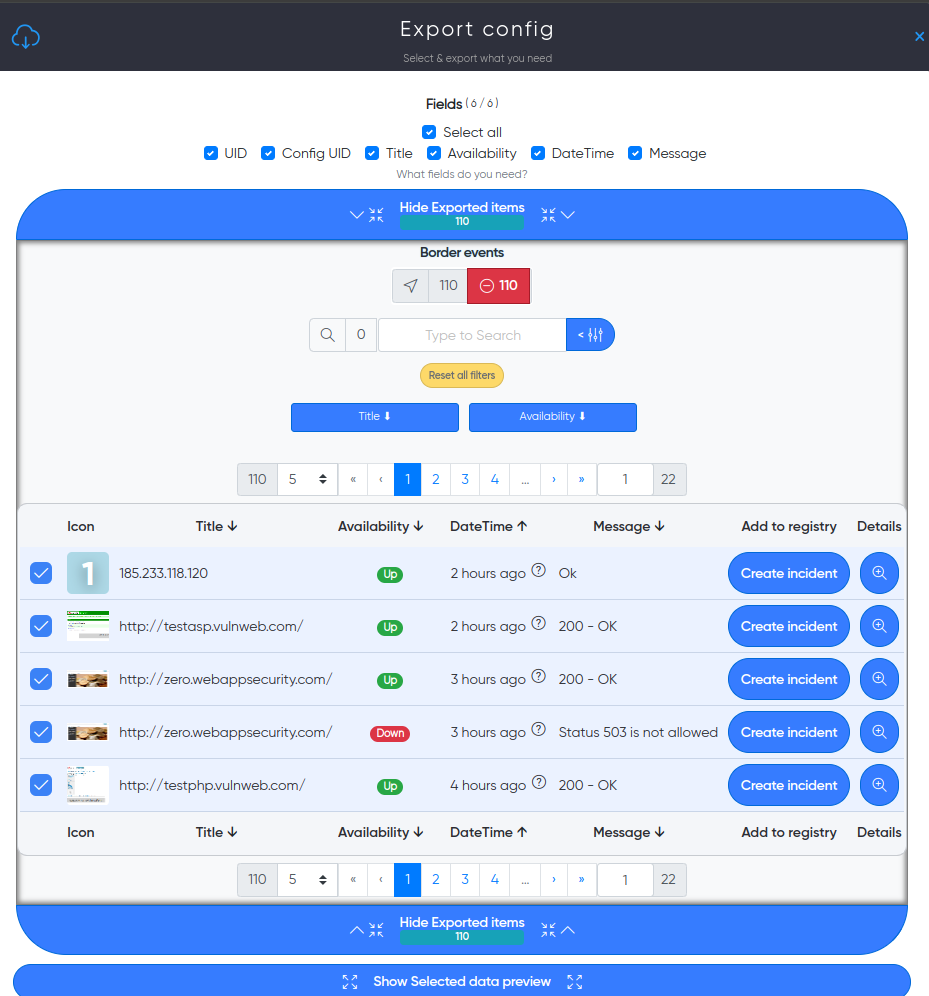
Sample Output: