¶ WhiteBox Source Code Scanner
WhiteBox is a tool for scanning source code of your projects. It combines multiple scanning engines that work automatically in parallel.
¶ First Steps
To get started, add an asset to your workspace. Supported asset types:
- GitHub repository link
- Archive with source code
¶ Ways to Scan
CryEye offers 3 scanning options:
- WhiteBox Service (legacy, to be deprecated)
- Simple Audit Project
- Singular Target Audit Project
¶ Comparison
¶ 🔹 WhiteBox Service
Pros:
- File tree & code view
- Facts and findings review
- Reports
- Audit scope presets
Cons:
- No custom audit scope
- No access to raw audit results
- No scheduler
- No notes or checklists
¶ 🔹 Simple Audit Whitebox Project
Pros:
- File tree & code viewer
- Customizable audit presets
- Detailed logs
- Original audit results
- Notes & checklists
- Multi-target support
- Scheduled scans
Cons:
- No WhiteBox-style findings view (coming soon)
- No reports (coming soon)
¶ 🔹 Singular Target Audit Project
Pros:
- Customizable audit scope
- Audit results
- Scheduled scans
- Notes & checklists
- Reports
Cons:
- No file tree or code viewer
- No presets
- No WhiteBox-style findings
¶ Create Project and Run Scan
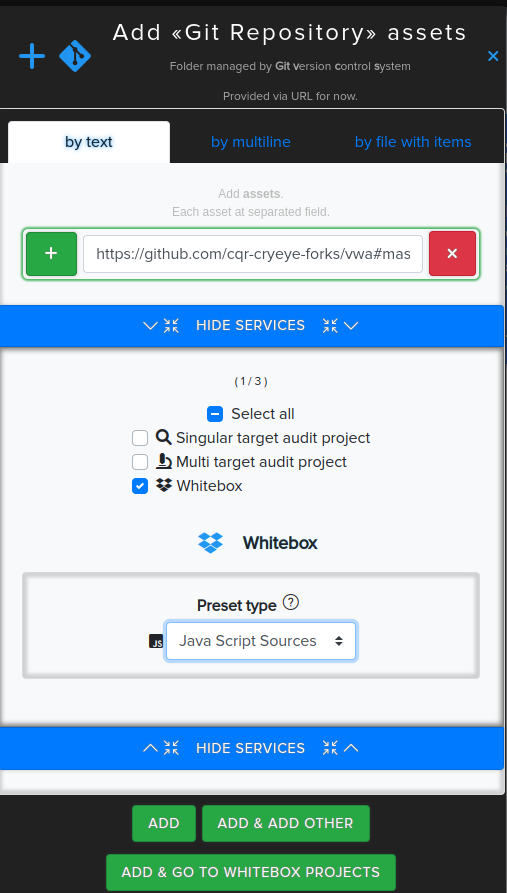
Example: Scan JavaScript vulnerable web app (vwa), branch master.
¶ WhiteBox Service
¶ Step 1: Create Project
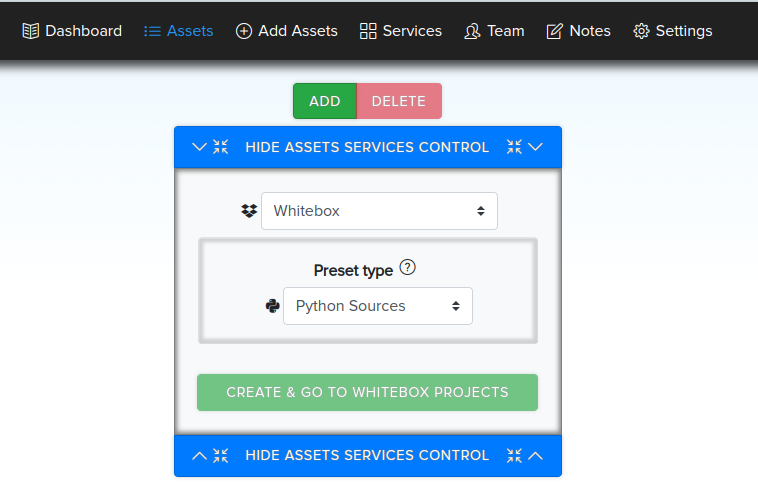
- Select "WhiteBox" in the Asset Services control
- Choose a preset
- Select your asset
- Click "Create and go to WhiteBox projects"

¶ Step 2: View Results
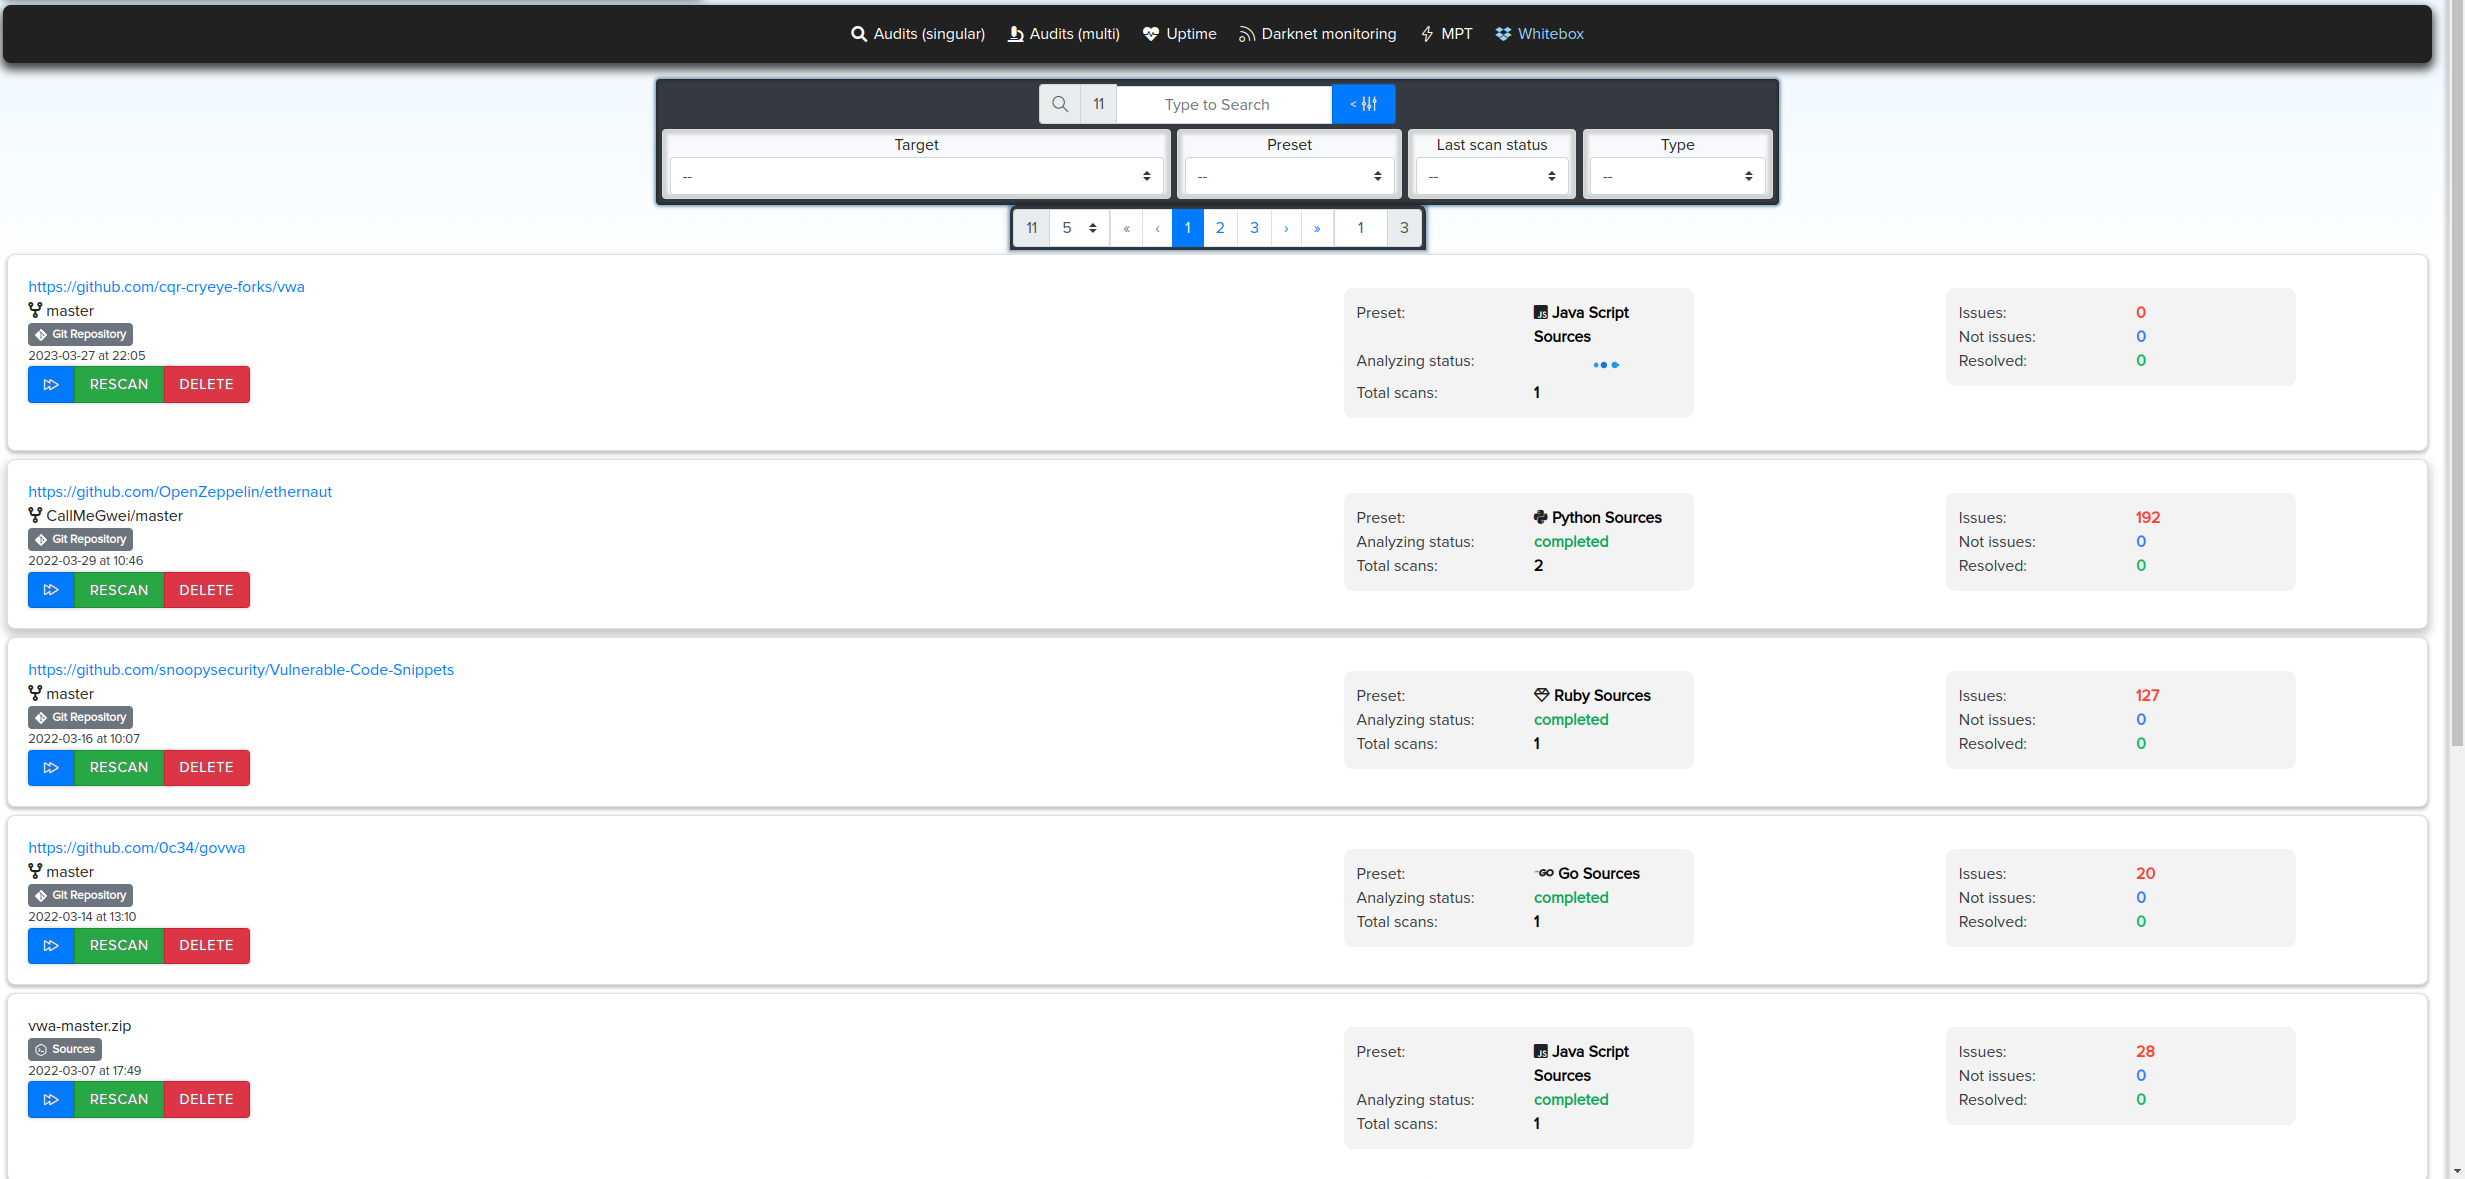
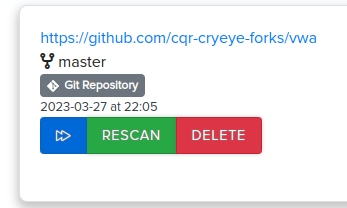
- 🔵 Blue arrow – open results
- 🔁 Rescan – rerun scan
- 🗑️ Delete – remove project
Results load during the scan. If multiple scans exist, you can choose which to view.
Includes:
- Scan summary (time, issue count, tools used)
- File tree + code viewer
- Findings list
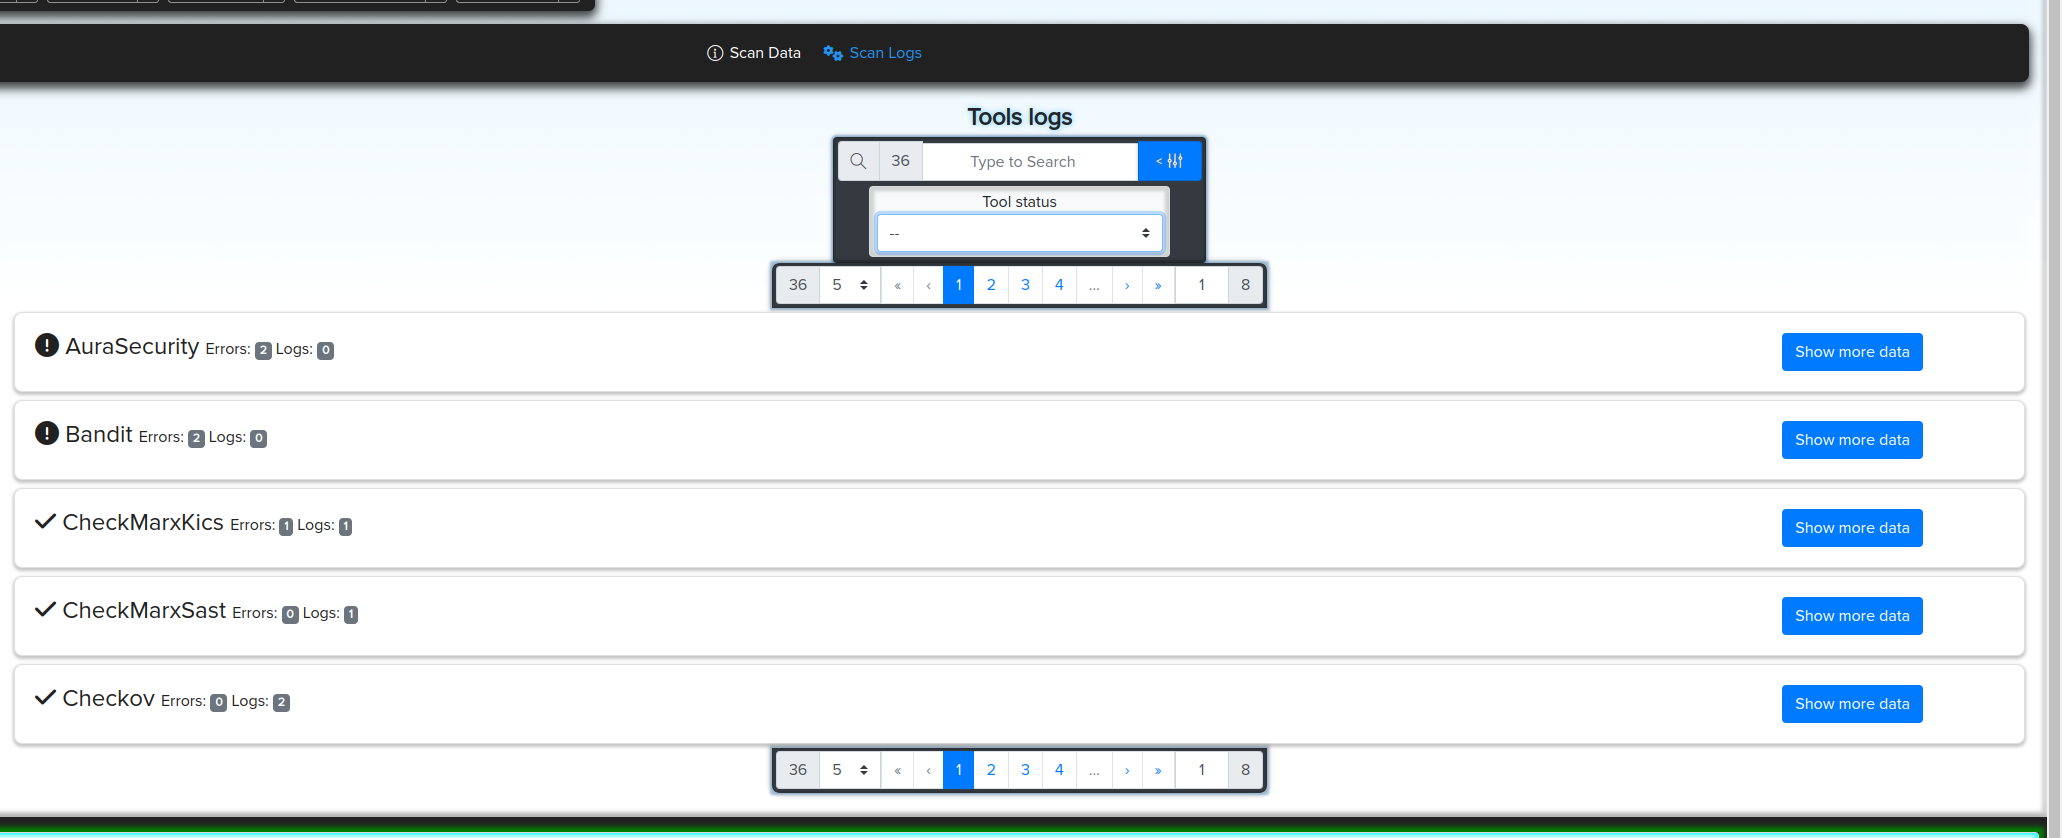
- Logs and parsing issues
¶ Simple Audit Project
Future preferred scanning method
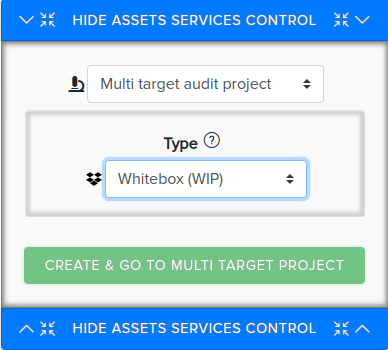
- Choose Simple Audit Project, type:
WhiteBox - Select one or more assets
- Click
Configure & Run

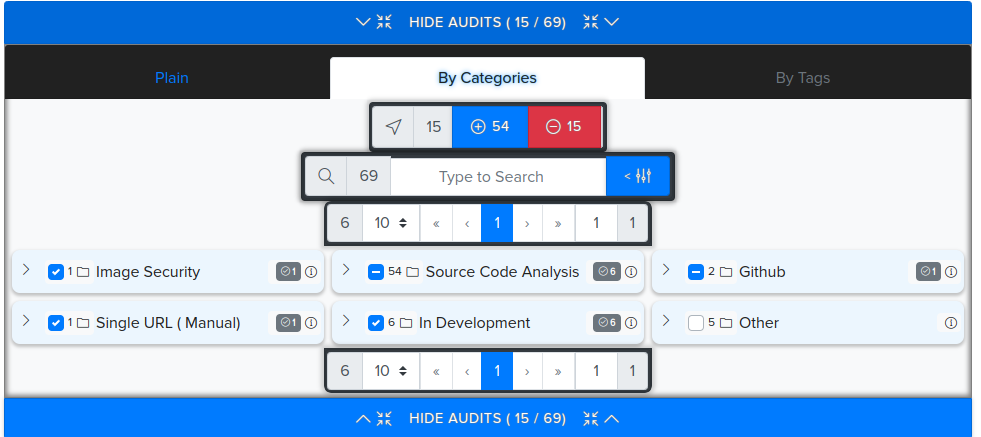
¶ Presets & Audits
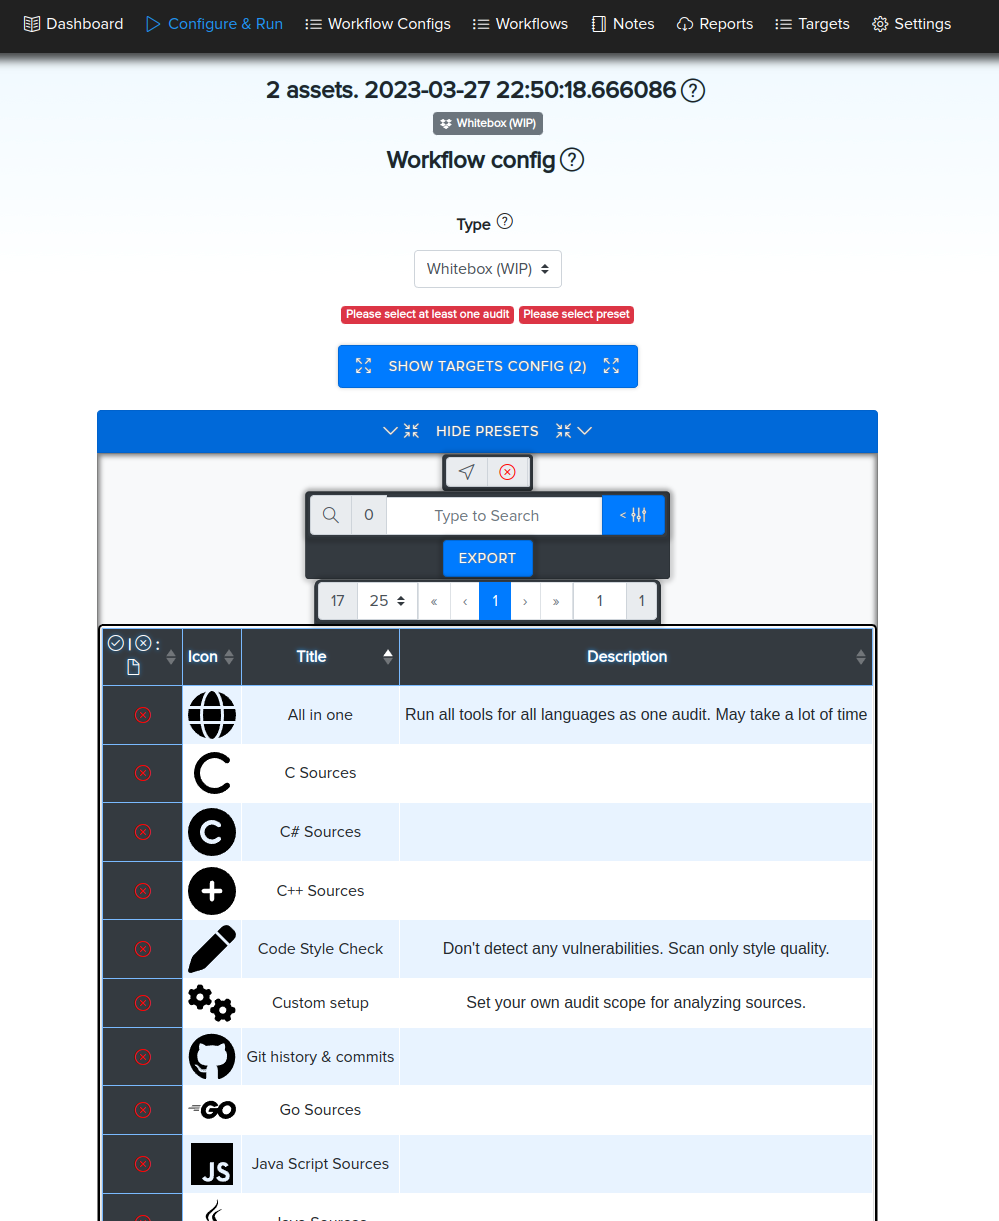
- Choose a preset
- View/modify selected audits
¶ View Results
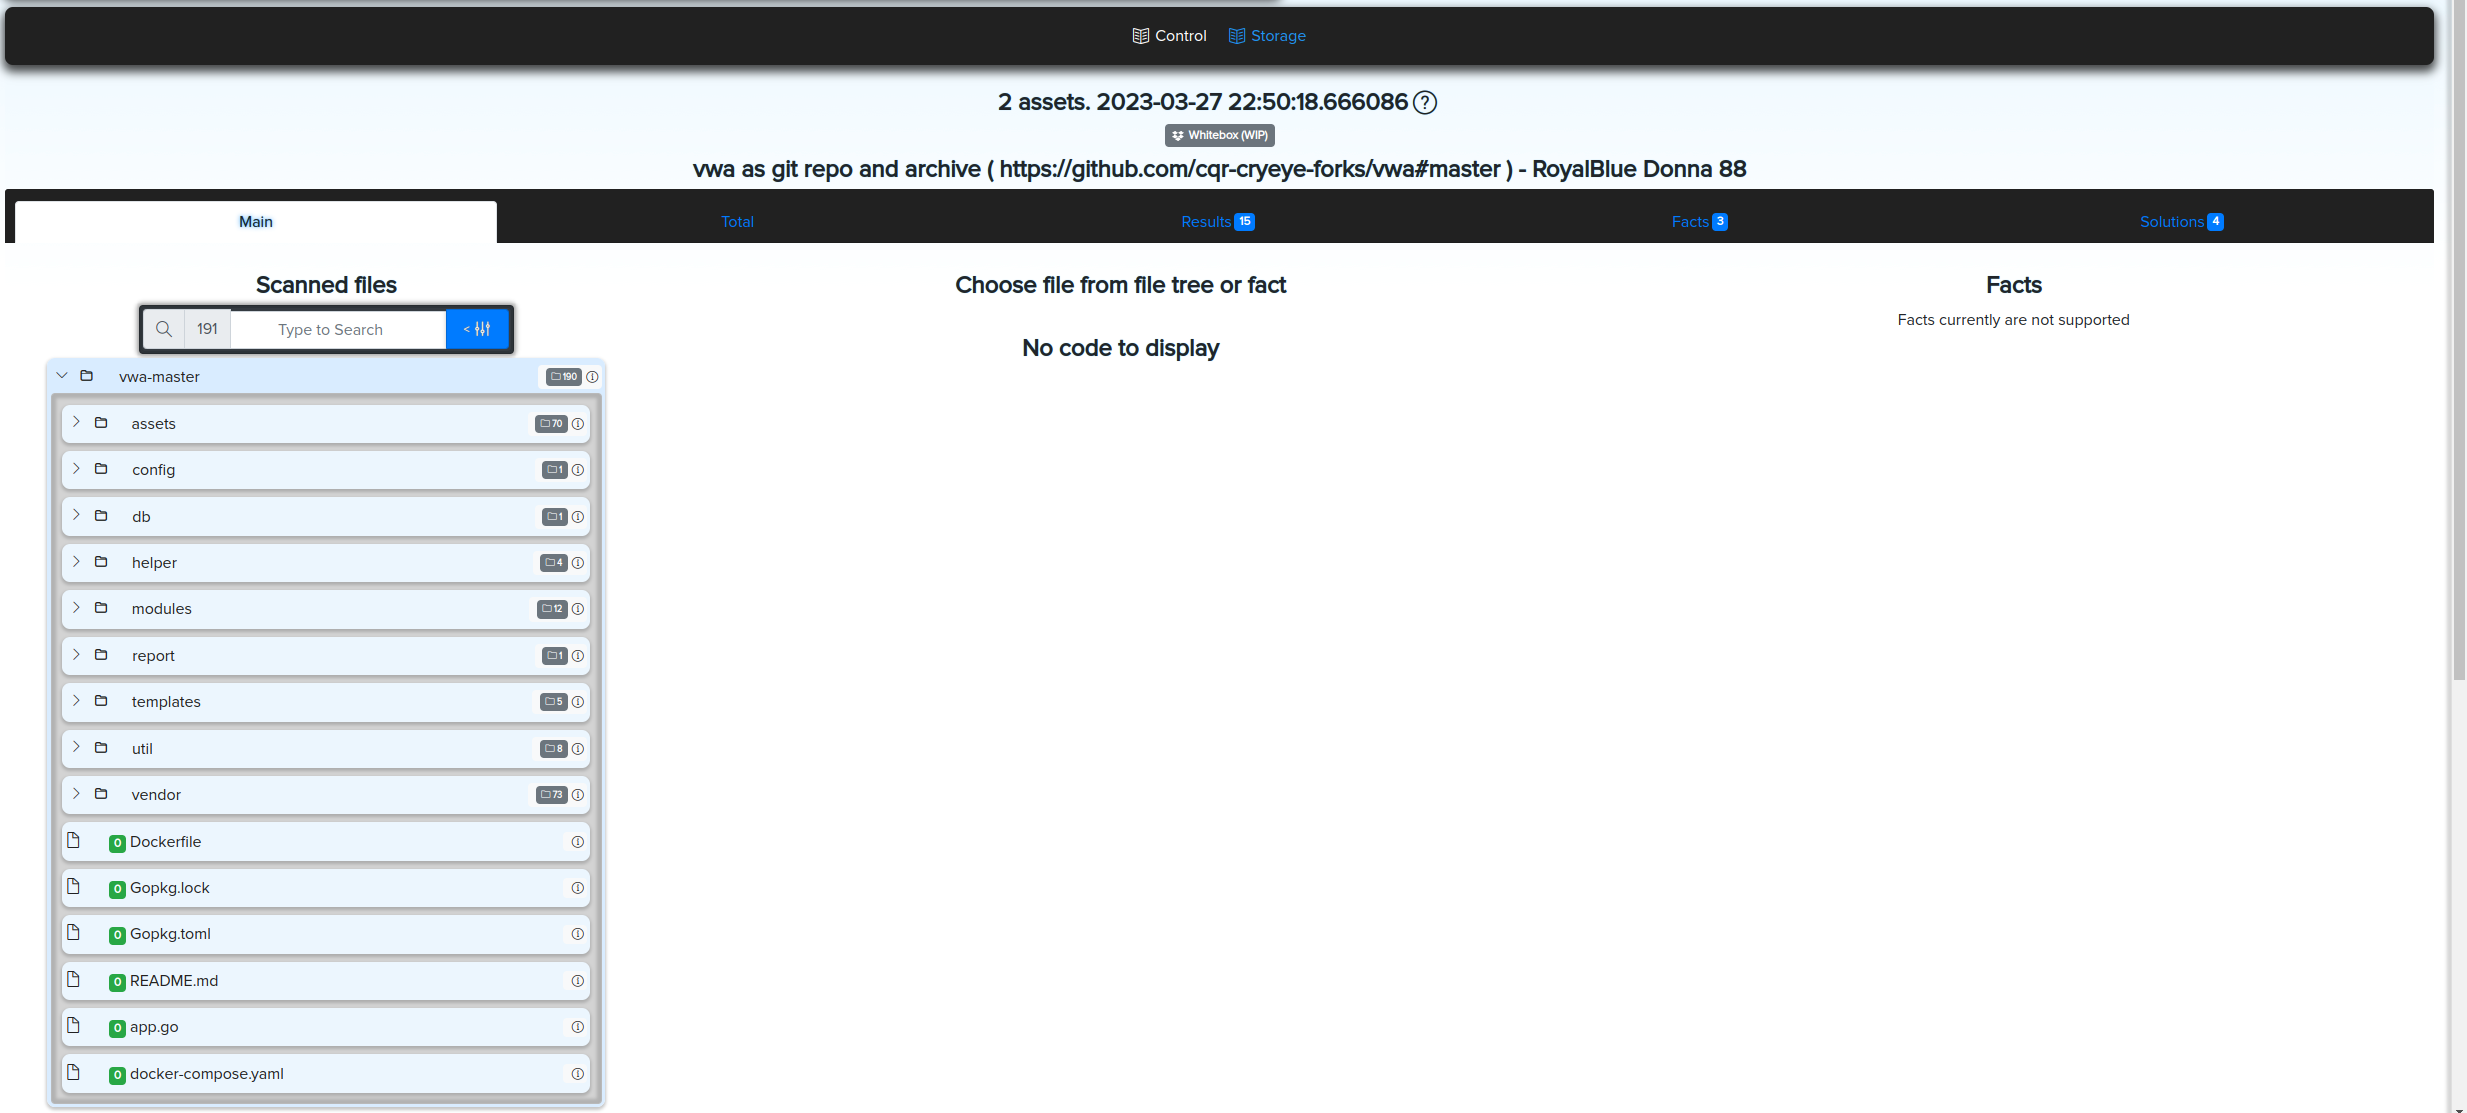
- Main Tab: file tree + code viewer (facts coming soon)
- Results Tab: audits results
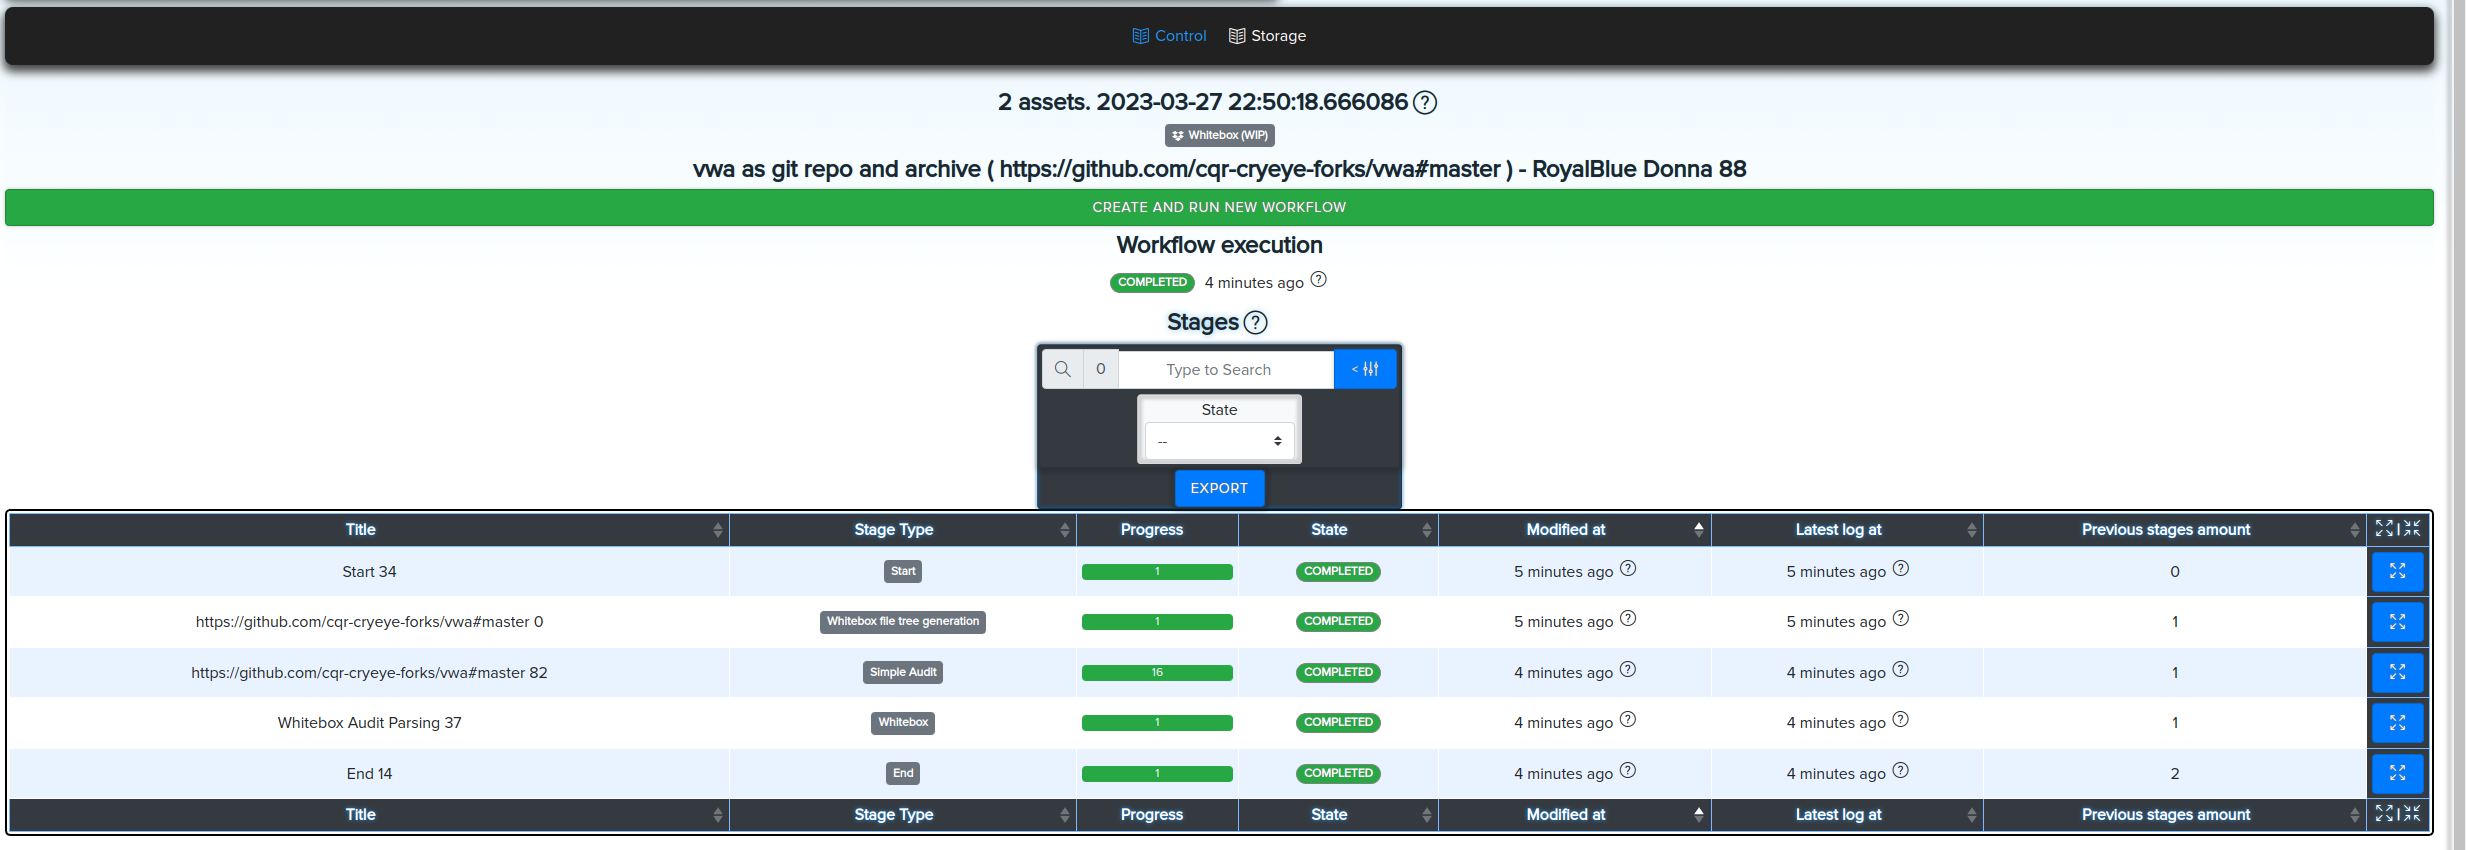
- Control Tab: logs per audit + post-processing
¶ Target Types Supported
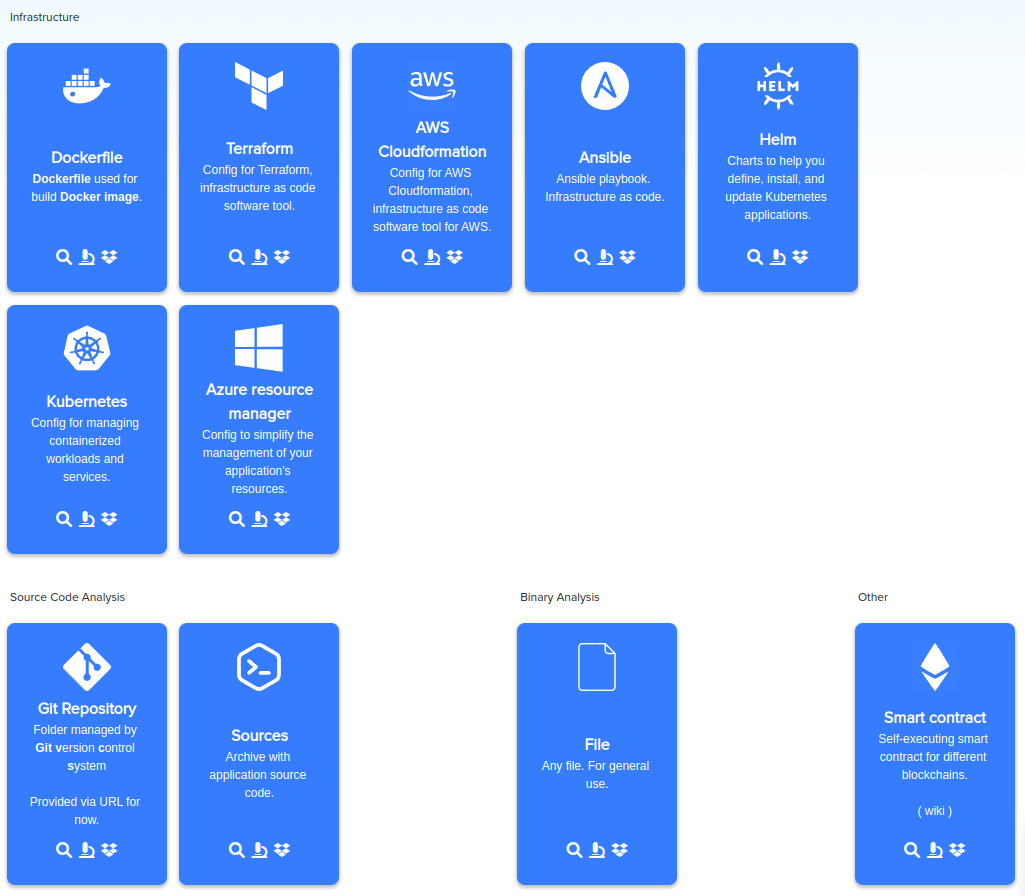
- Git repository
- Zip archive
- Dockerfile
- Terraform
- AWS CloudFormation
- Ansible
- Helm
- Kubernetes
- Azure Resource Manager
- Smart Contract
- File
¶ Git Repository Format
https://github.com/user/repo(default branch only)https://github.com/user/repo#branch-name(recommended)https://github.com/user/repo/tree/branch-name(also supported)
¶ Presets
WhiteBox supports the following languages & technologies:
- Go
- Java
- JavaScript
- Kotlin
- PHP
- Python
- C#
- C++
- C
- Ruby
- Rust
- Scala
- Leaks
- Git
- All-in-One
- Style Check
- Custom – manual audit selection (multi-target only)
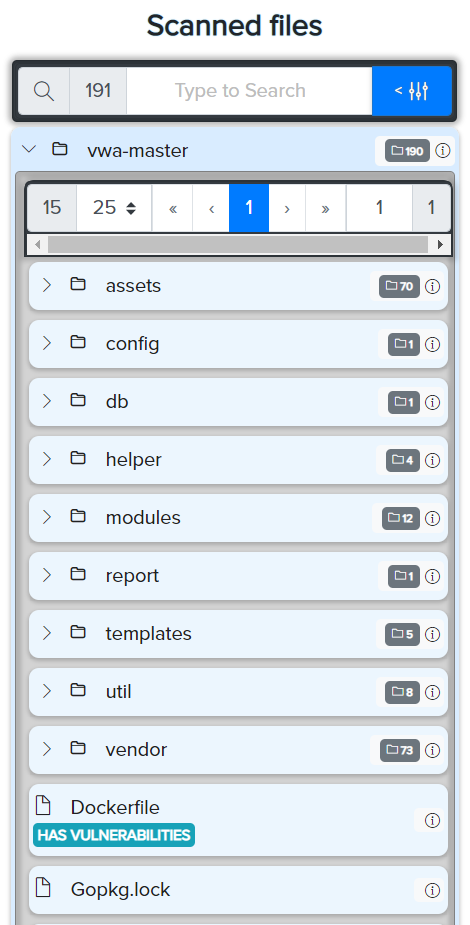
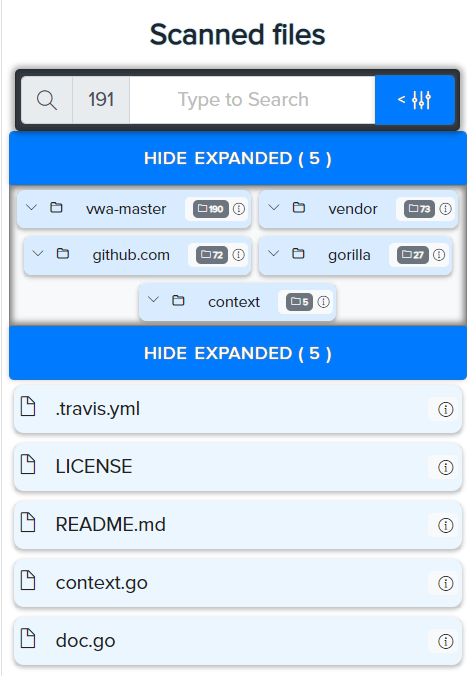
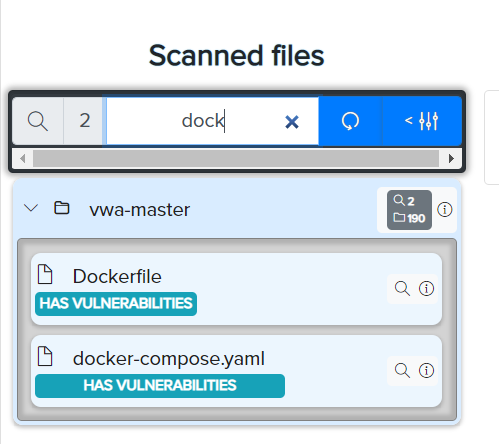
¶ File Manager
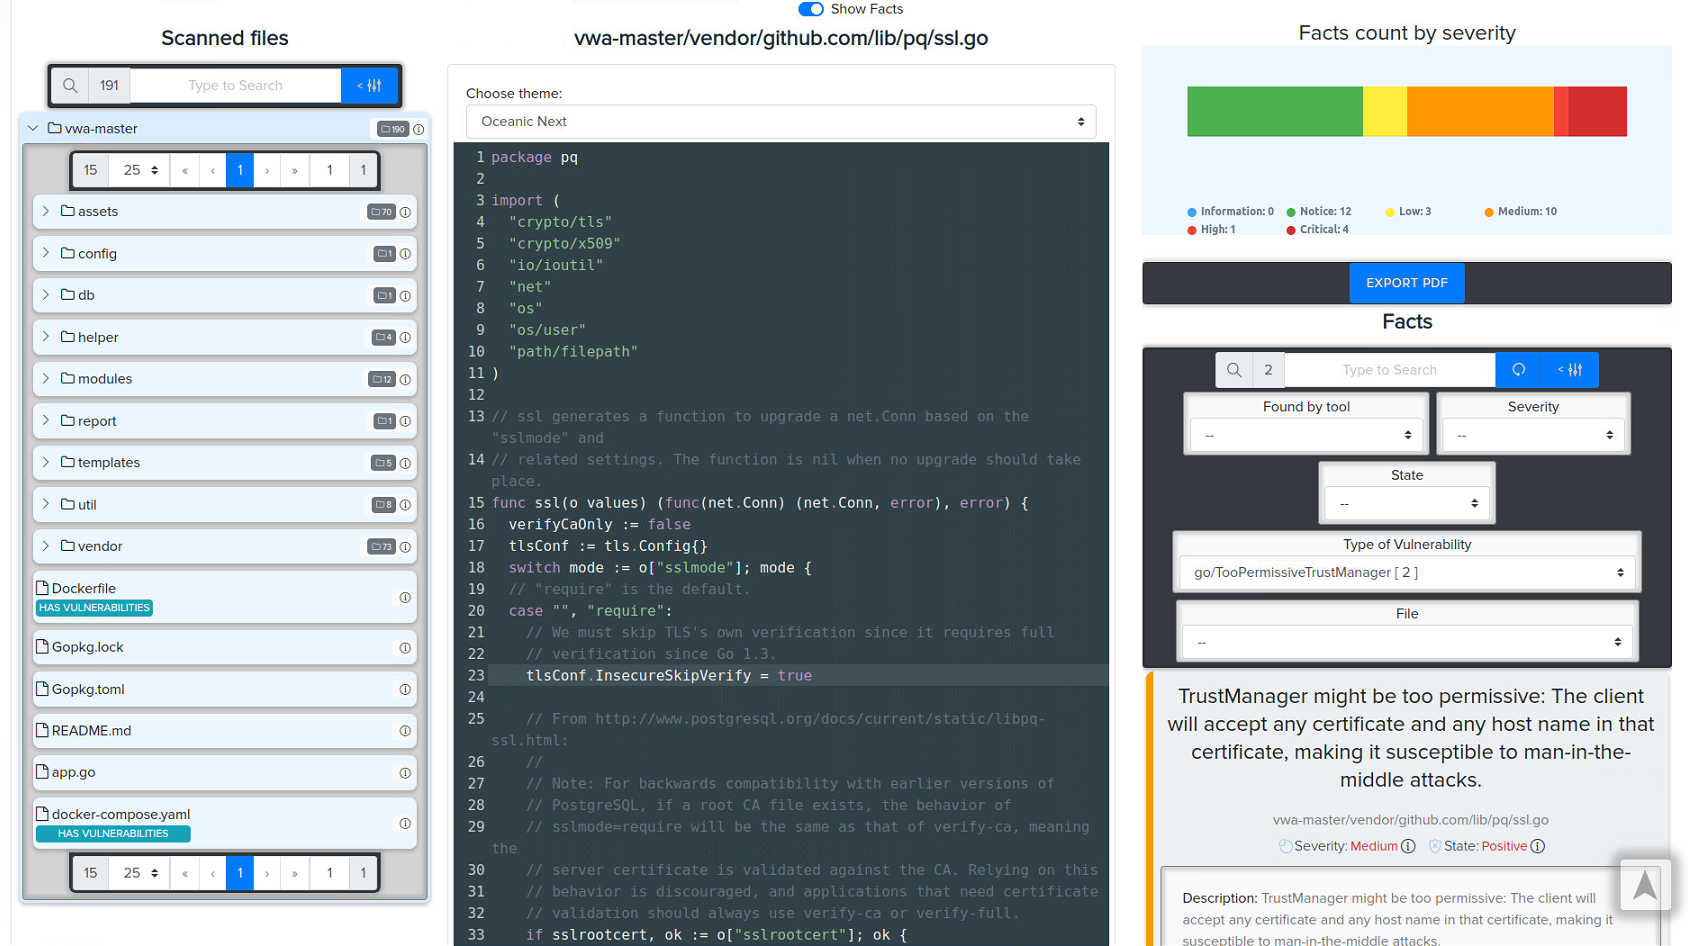
Displays scanned file structure.
- Alerts if file contains issues
- Breadcrumb navigation
- File search
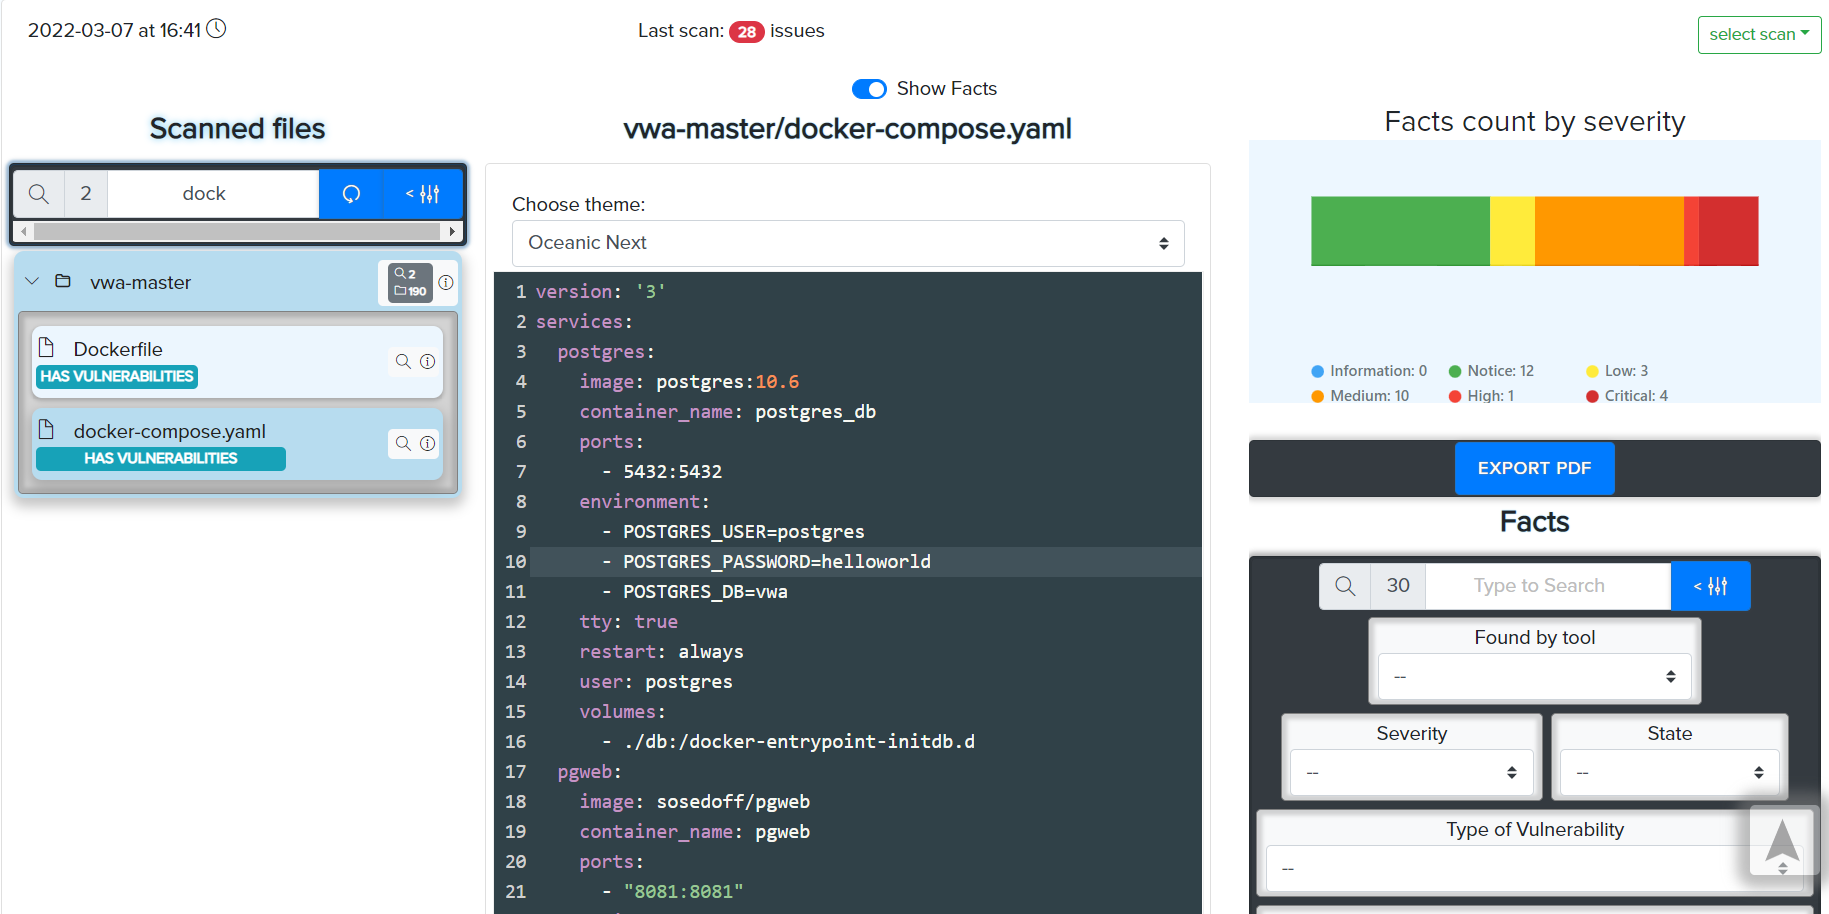
- Inline code viewer
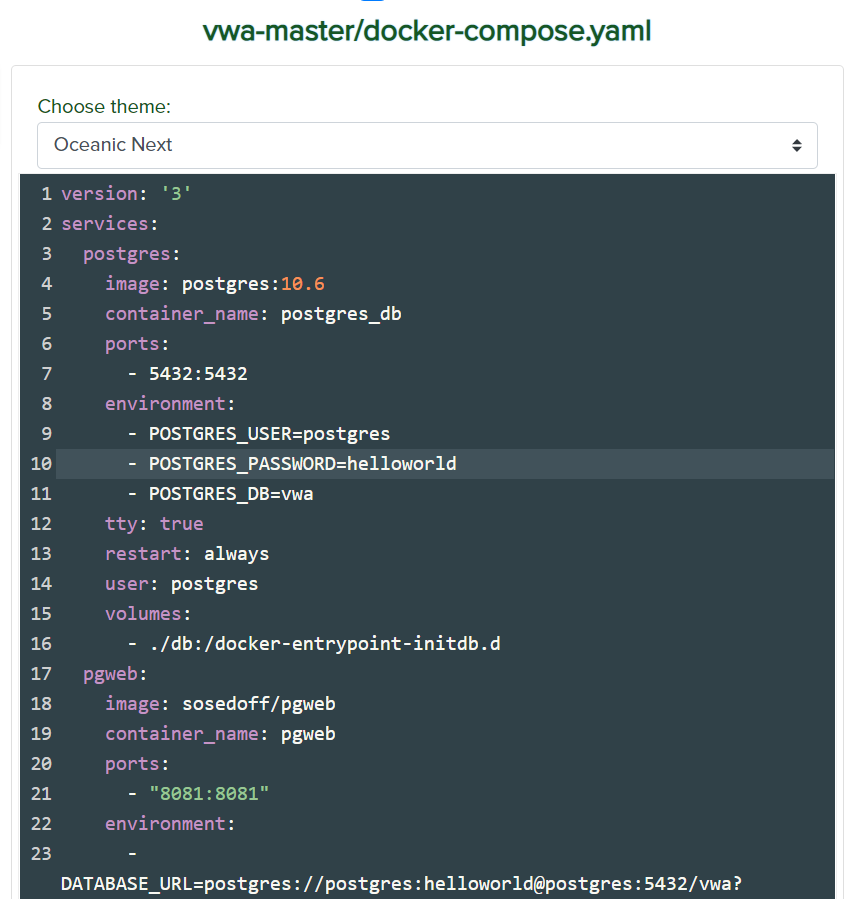
¶ Code Viewer
- Highlighted lines = vulnerabilities
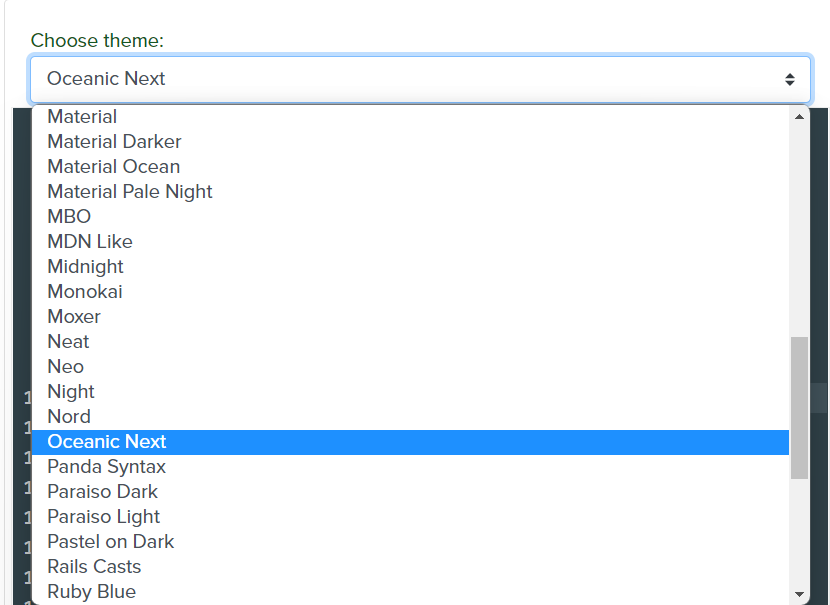
- 50+ themes available
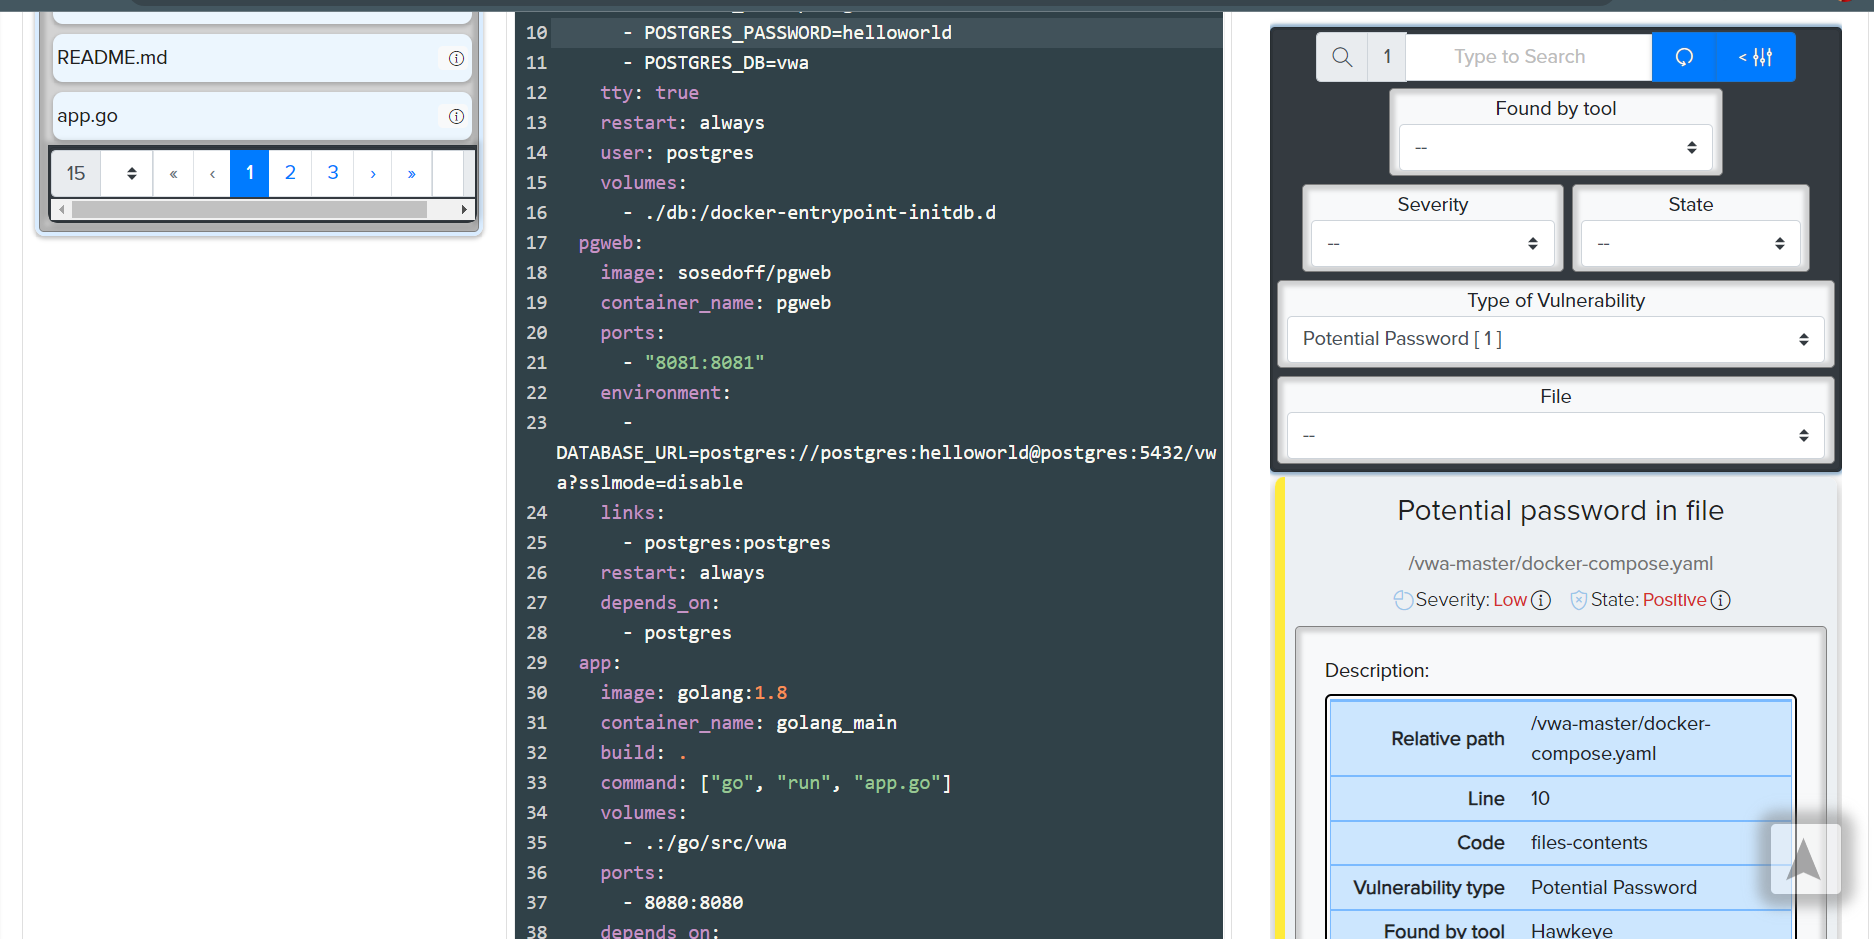
¶ Facts
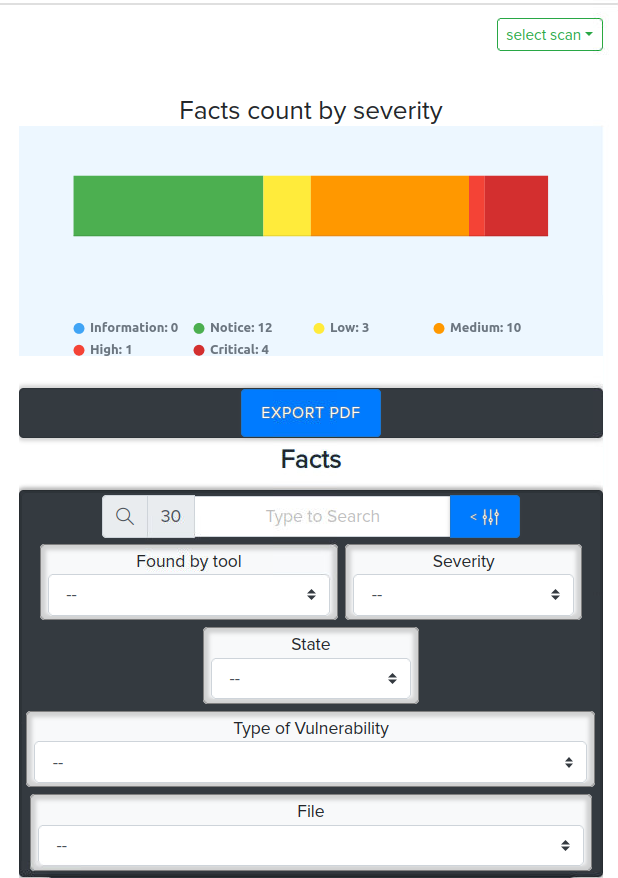
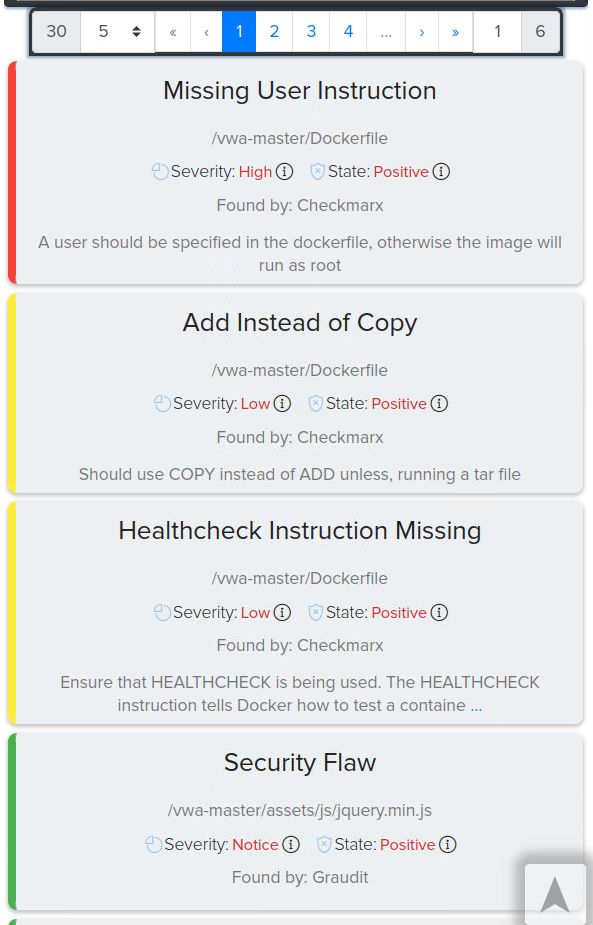
Facts = identified vulnerabilities and security issues.
Located on the right side of the asset page.
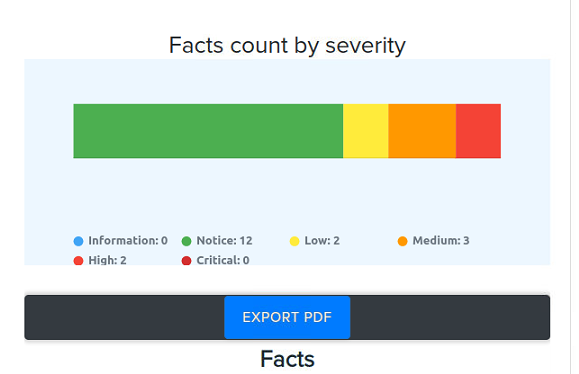
- Severity diagram
- Filterable list
- Direct link to code line
¶ Fact Filters
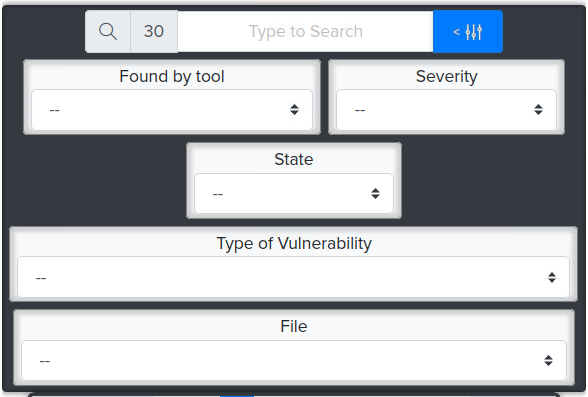
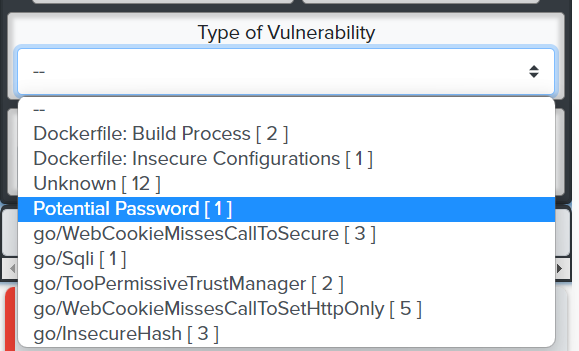
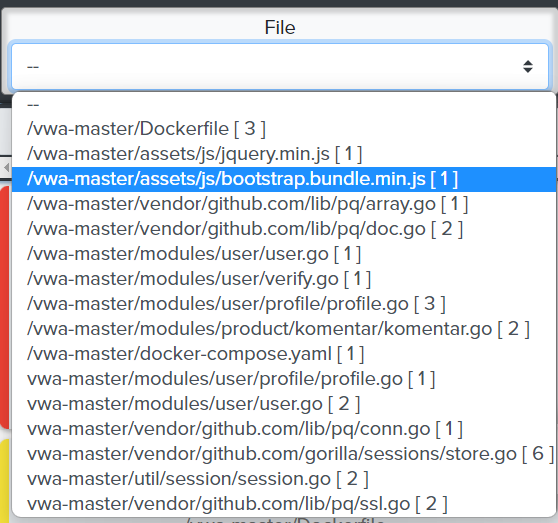
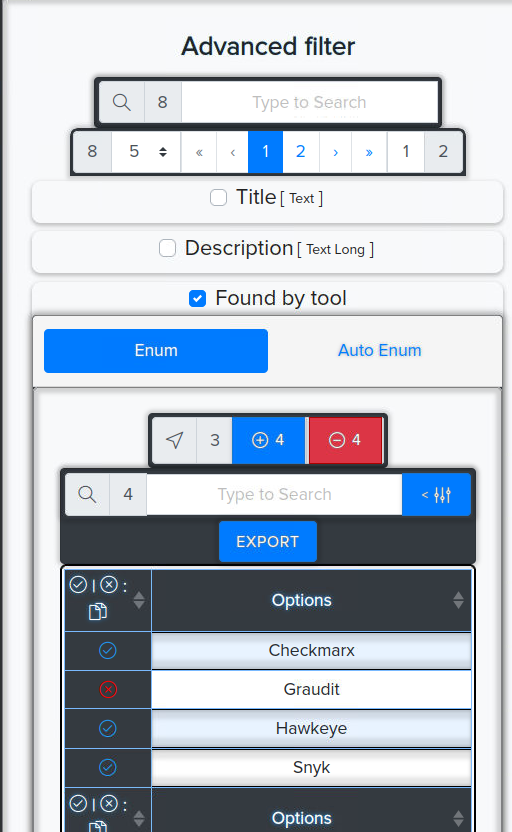
- Filter by type, severity, file, tool
- Advanced filters available
¶ Export Facts
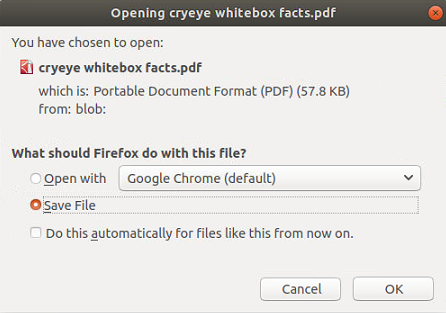
- Click
Export PDF - Save the generated report
¶ Integrated Tools
WhiteBox integrates 40+ scanning tools including:
- Aura Security
- Bandit
- Checkov
- SonarQube
- Whispers
(...and many more – see full list in documentation)